

My Marks and Spencer share price forecast includes a 360-degree examination to determine whether investors should consider this renowned retailer and add the stock to their baskets.
This stock analysis report goes into detail on Marks and Spencer’s financial position, competitive strengths, industry outlook, valuation metrics, and analysts’ predictions to uncover whether Marks and Spencer shares actually present a golden long-term opportunity.
Read On: To find the Marks and Spencer share price forecast and my price target.
- Marks and Spencer Share Price (LON:MKS)
- Marks and Spencer Background
- Marks and Spencer Business Model
- Marks and Spencer Earnings Breakdown
- Marks and Spencer Financials
- Marks and Spencer Competitive Advantage
- Marks and Spencer Shortcomings
- What is the Dividend Forecast for Marks and Spencer Shares?
- Are Marks and Spencer Shares Cheap?
- What is the Profit Forecast for Marks and Spencer Shares?
- What is the Marks and Spencer Share Price Forecast?
- What is the Price Target for Marks and Spencer Shares?
- Are Marks and Spencer Shares a Buy, Sell, or Hold?
[stock_market_widget type=”card” template=”basic2″ assets=”MKS.L” display_currency_symbol=”false” style=”font-size: 1.0rem” api=”yf”]
Marks and Spencer Background
Marks and Spencer is one of the oldest retail chains in the UK. It operates over a thousand stores throughout the UK, Ireland, and other international regions, as well as its joint venture with Ocado.
Founded in 1884, it originally operated in the apparel and home improvement space, before recently venturing into food and groceries. Aside from that, the company is also involved in food and drink wholesaling activities. It also offers its own banking and insurance services via M&S Bank in partnership with HSBC.
Marks and Spencer shares trade on the London Stock Exchange and are constituents of the FTSE 100.
Marks and Spencer Business Model
As a conglomerate, Marks and Spencer makes its money through a variety of revenue streams. The bulk of its sales stems from the UK, in its retail arm, where it sells groceries, apparel, and other household items. On top of that, the firm’s presence internationally also racks up another c.£1bn worth of revenue.
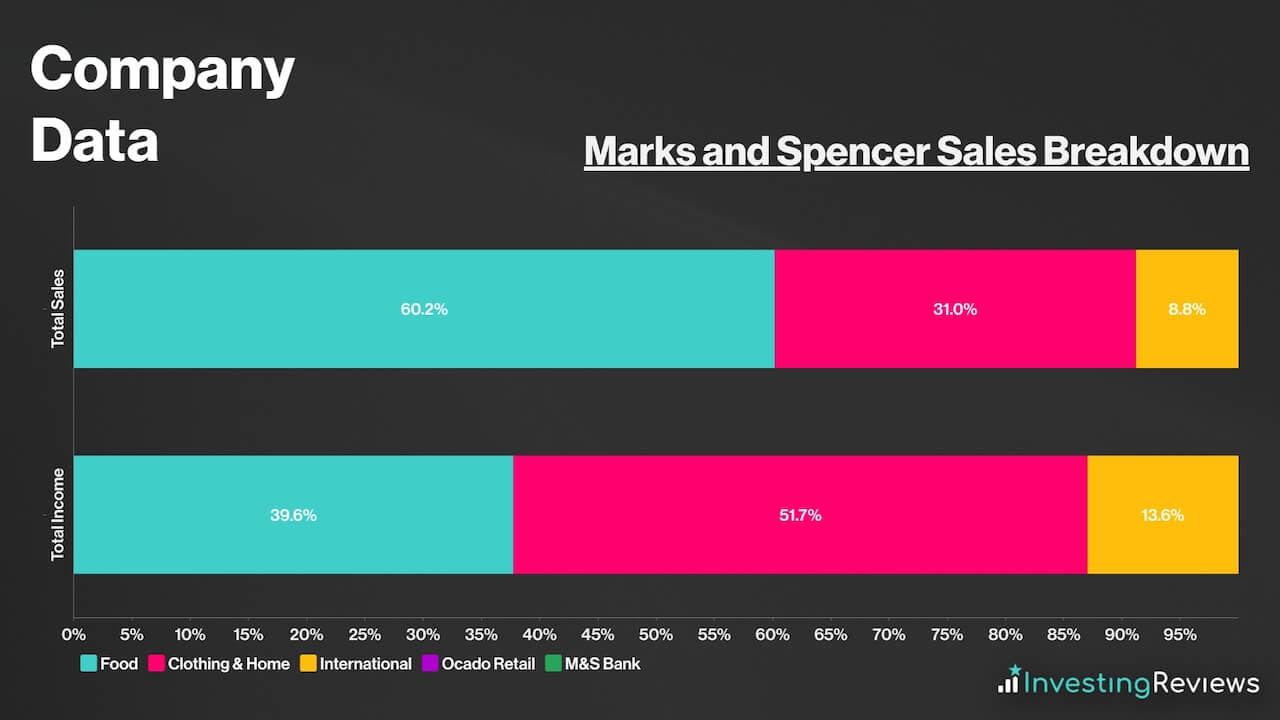
Although Marks and Spencer generates the bulk of its revenue from its food segment, it’s worth pointing out that the majority of its profits still come from its clothing and home arm. This is because profit margins tend to be higher in apparel and household items. In addition to that, M&S normally earns a small portion of its income from M&S Bank and its joint venture with Ocado retail, but those segments posted losses in its most recent financial year.
Marks and Spencer Earnings Breakdown
Marks and Spencer operates a retail business model for the most part, and earns its profits from buying items in bulk at wholesale prices, and then selling them to customers at a higher price to turn a profit.
As for its financial services arm, a slightly more complicated business model is involved. M&S Bank earns its income through two methods. The first is through net interest income — income generated from assets (interest on customer loans) minus liabilities (interest paid to customer deposits). The second is through fee income, where it collects fees from customers’ credit card spending and foreign currency spreads.
Because most of Marks and Spencer’s profits stem from its clothing and home arm, its overall profit margins are slightly higher than its supermarket peers in the UK. That’s because the business operates a unique hybrid business where it places an equal amount of importance on apparel, household items, and food, unlike traditional supermarkets.
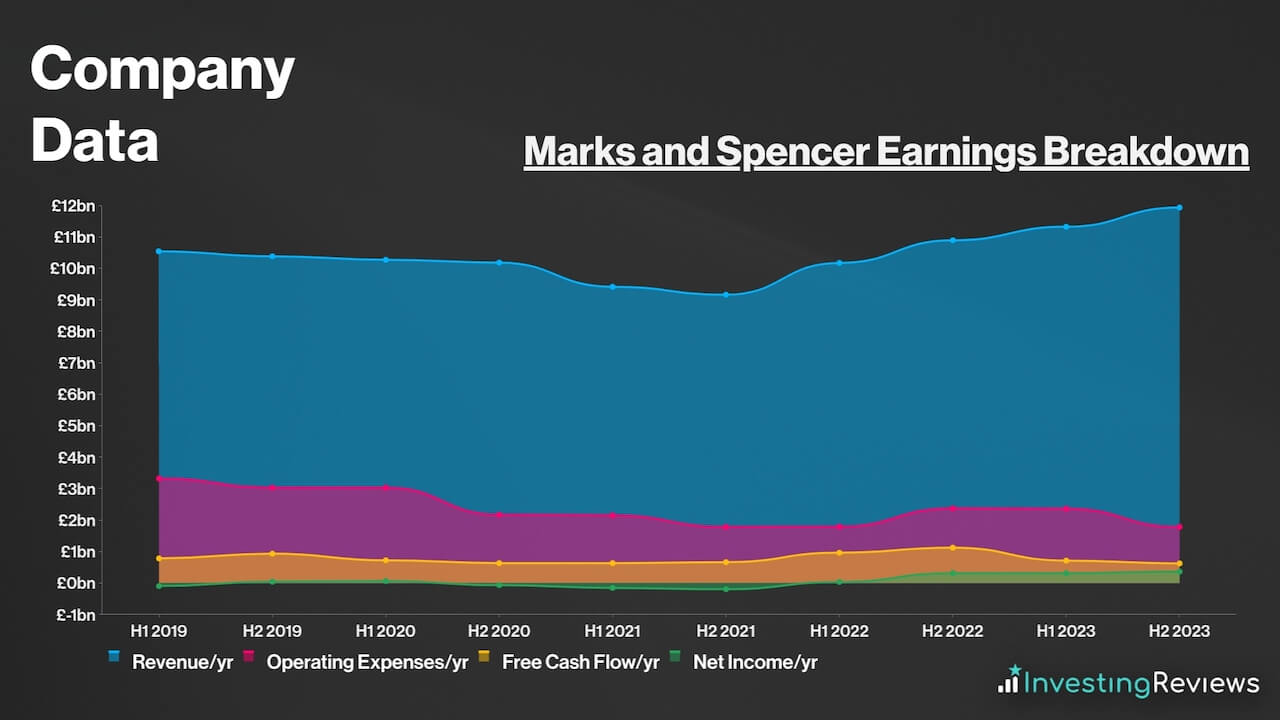
Marks and Spencer Financials
On the face of it, Marks and Spencer’s balance sheet may be off-putting to some as its current liabilities trump its current assets by £551m. Nonetheless, this is considered to be a norm in the retail industry, especially for giant retailers. This is due to a neat trick where retailers use credit (debt) to purchase fast-moving consumer goods, which tend to sell in 90 days or less. This is categorised as “Trade and Other Payables” on the group’s balance sheet.
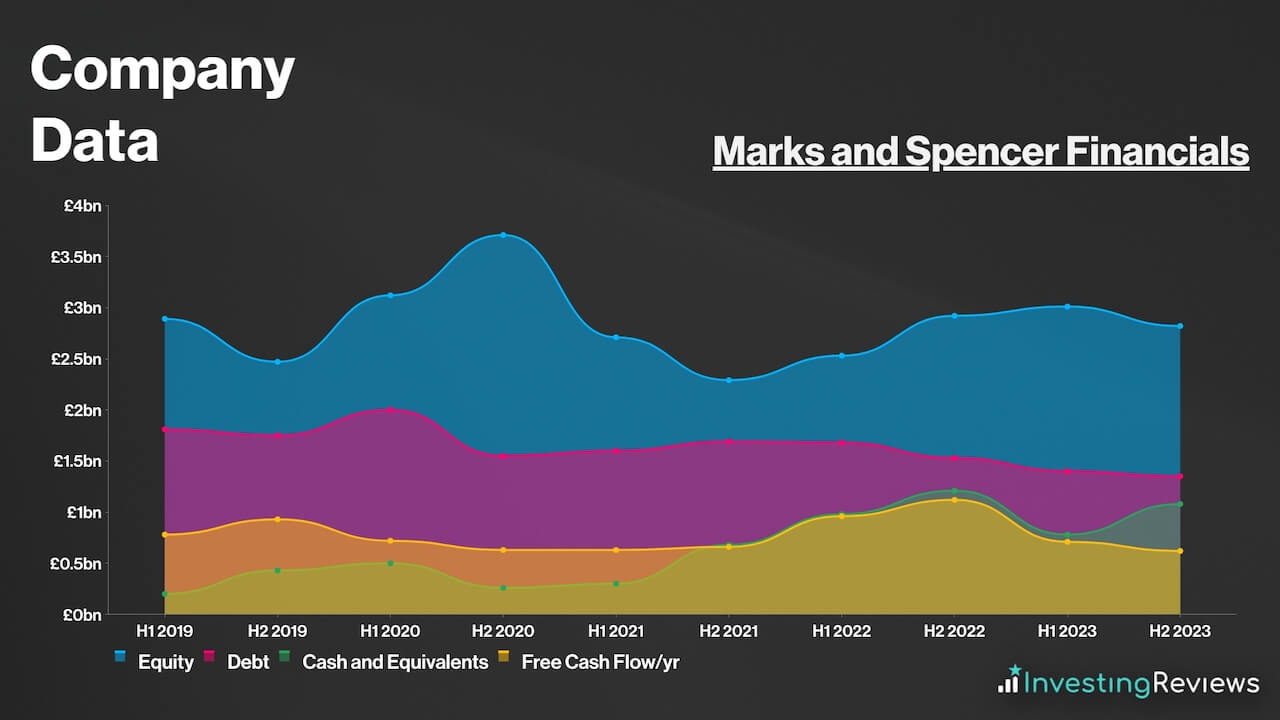
Therefore, it wouldn’t be unreasonable to discount this amount (£2.05bn) from Marks and Spencer’s current liabilities as they’re more likely than not to meet those obligations given their large customer base. Thus, excluding Marks and Spencer’s “Trade and Other Payables”, its current liabilities then shrink from £2.05bn to £0.66bn, which can be easily covered by its current assets worth £2.16bn.
Upon taking this figure out, Marks and Spencer’s balance sheet looks a lot healthier, with a debt-to-equity ratio of 48%. This is comparably better than its other local competitors who have much higher debt levels.
Even so, the corporation still holds £1.37bn worth of debt, excluding lease liabilities. Thankfully, Marks and Spencer’s liquidity and free cash flow can sufficiently cover its short-and-long-term obligations without fuss. Either way, its debt maturity profile isn’t alarming, with repayments spread out rather evenly over the course of the next decade or so.
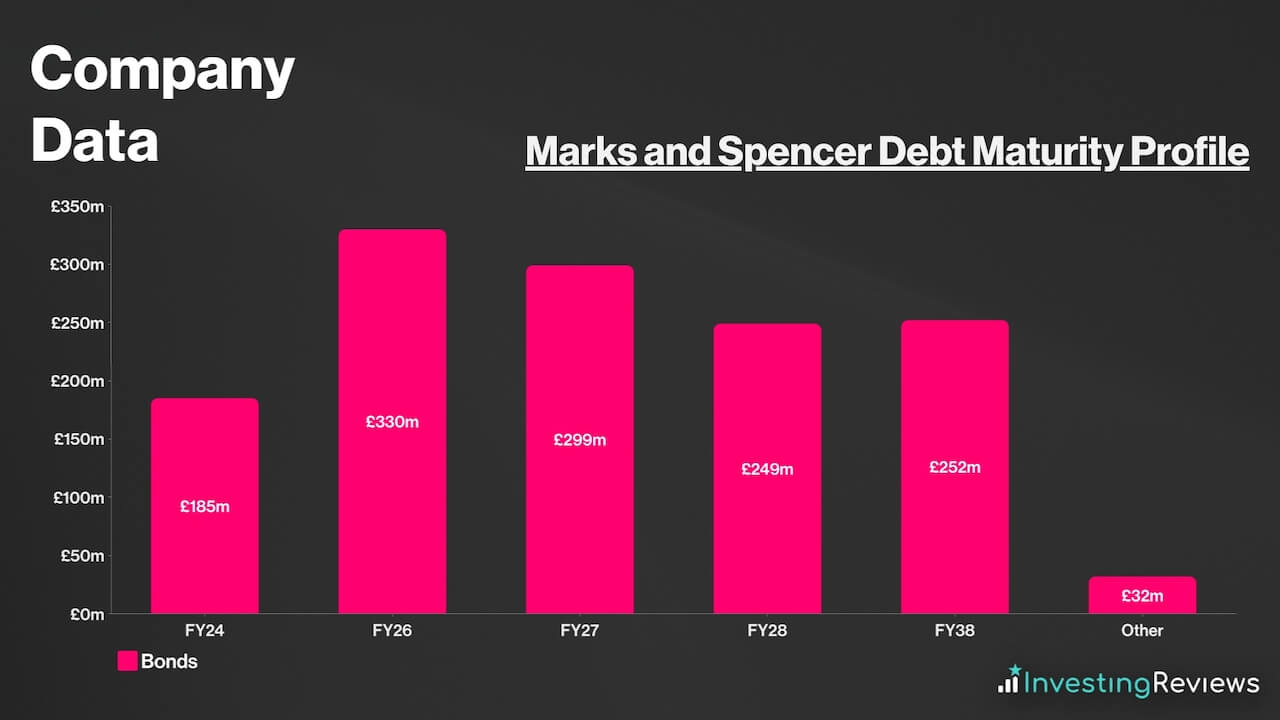
With less than £200m due in the coming year, and another c.£1bn due over the next decade and further, Marks and Spencer should have sufficient liquidity to pay off its debt in the coming years, as long as it continues to generate free cash flow at its current levels and grow its working capital. It’s also worth noting that Marks and Spencer has £850m worth of revolving credit facilities. This means that the business has the option to inject more liquidity into the business if it needs to.
Overall, Marks and Spencer currently has a net debt to EBITDA ratio of 2.3x, with cash flow to net debt also at levels consistent with an investment-grade credit rating. This is much better as compared to giants like Tesco and Sainsbury’s. For those reasons, it’s safe to say that M&S’ debt pile is manageable, as the board continues to efficiently utilise capital and generate further value for shareholders.
Marks and Spencer Competitive Advantage
Having an economic moat (competitive advantage) over competitors is crucial in saturated industries such as food and retail, where profit margins aren’t the highest, with low barriers to entry.
As such, M&S’ unique selling proposition would be its tremendous quality. Their products are renowned for being one of, if not the best products that customers can purchase, albeit at a premium usually. But what really makes the retailer stand out is its unique omnichannel offering in groceries through Ocado Retail, as well as clothing and home. M&S is one of the only retailers that offer such a proposition to its customers.
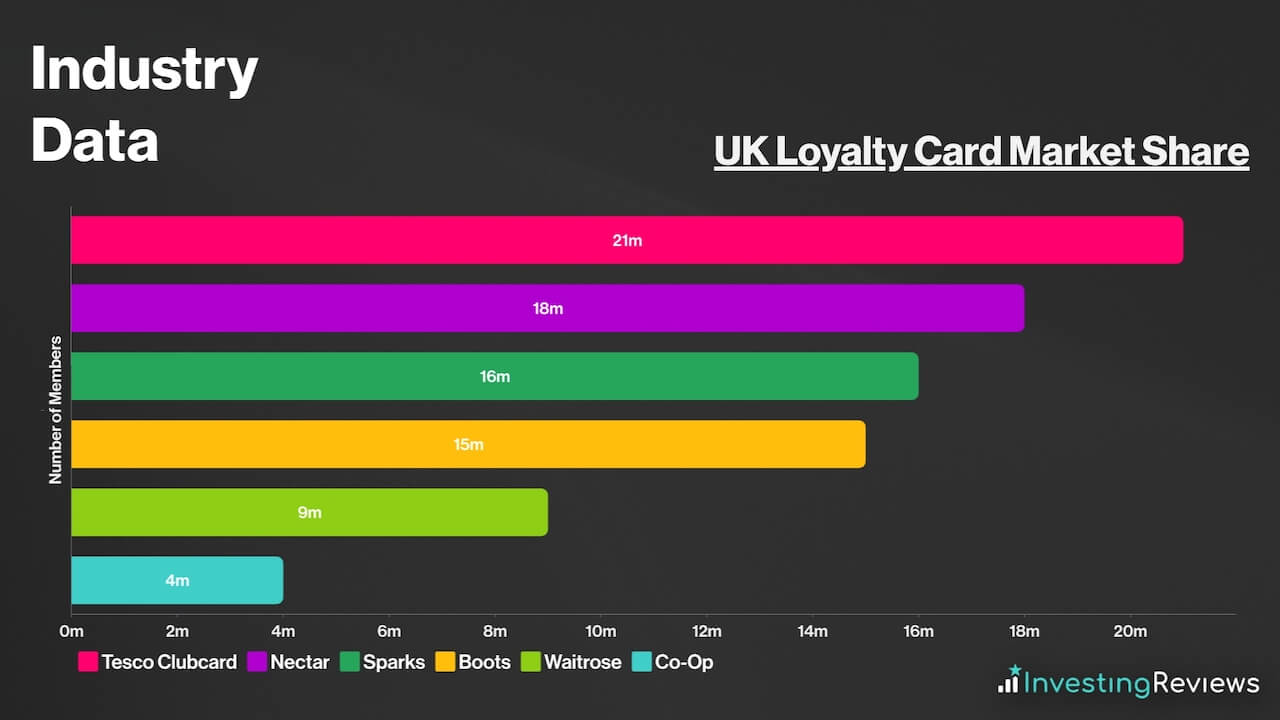
And with more than 1,000 stores across the UK, multiple M&S stores can be found in most cities across the country. To complement this, M&S has millions of users who are registered for its Sparks loyalty programme. This has grown to a total of 16m users across all countries with more than 5m monthly active users across the UK.
Due to its massive user base, Marks and Spencer leverages this by offering perks to those who own a Sparks card in an attempt to attract customers to shop with them. Shoppers can get exclusive and personalised discounts based on their shopping habits, allowing them to get discounts on items that they may be more interested in.
Loyalty cards aside, Marks and Spencer is also known for being one of the best supermarkets to shop at in terms of customer satisfaction. The latest Which? survey crowned M&S as the best place to shop at. Combine that with its recent acquisition of Gist, and M&S should be able to take better control of its supply chain and subsequently, its cost structure. This should lead to fewer disruptions and higher profit margins over the long term.
Marks and Spencer Shortcomings
Despite being such a giant in the retail space, Marks and Spencer also has its fair share of weaknesses. This could put investors off when buying Marks and Spencer shares.
For one, its profit margins are rather slim. Even though they’re a tinge higher than volume supermarkets, they still aren’t particularly high — ranging from 1% to 3% in a good year. This means that a black swan event like an outbreak linked to its supply chain, for example, could plunge Marks and Spencer into unprofitability.
Moreover, Marks and Spencer is still in recovery mode, particularly with its clothing and home segment. Management has done a decent job onboarding fresher and more modern lines of apparel, but it’ll need more momentum before being able to challenge the bigger players in the market again.
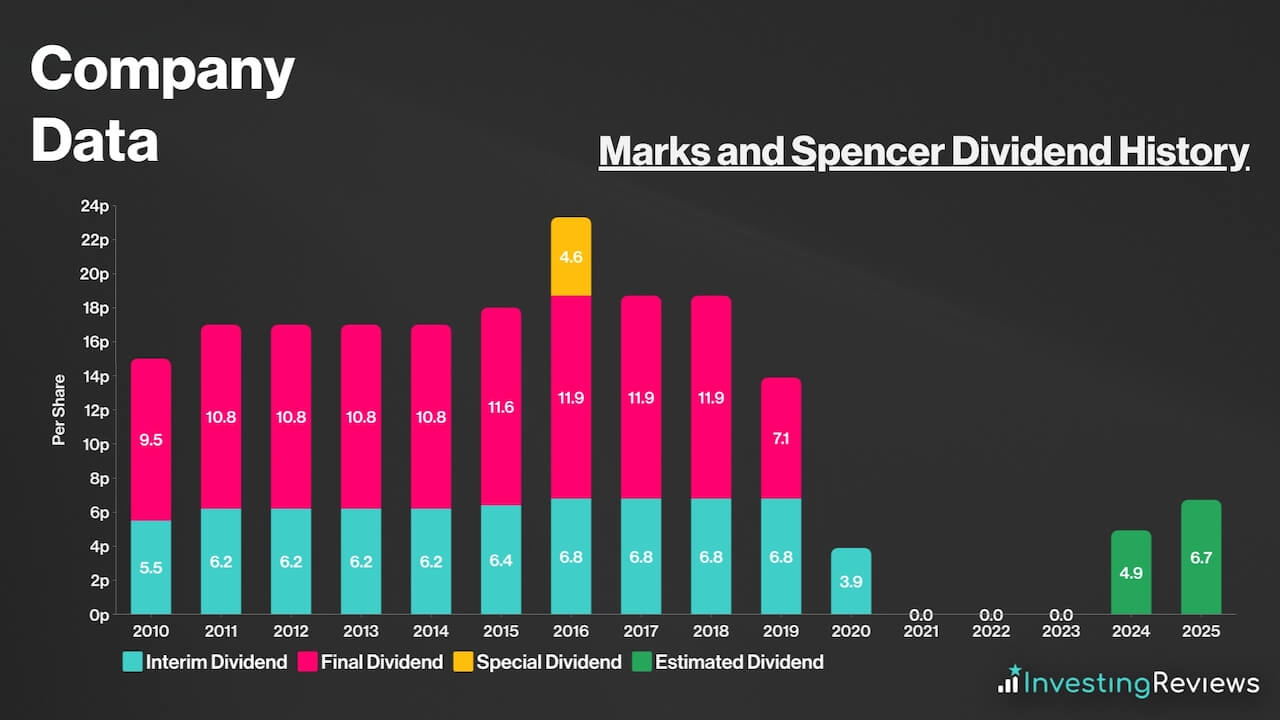
Furthermore, on the dividend front, Marks and Spencer has paused its payouts to shareholders since 2019 amid lower profitability and the pandemic. Considering that there are other blue-chip names out there with better prospects and higher dividends, this could dampen the buy case for Marks and Spencer shares for certain investors.
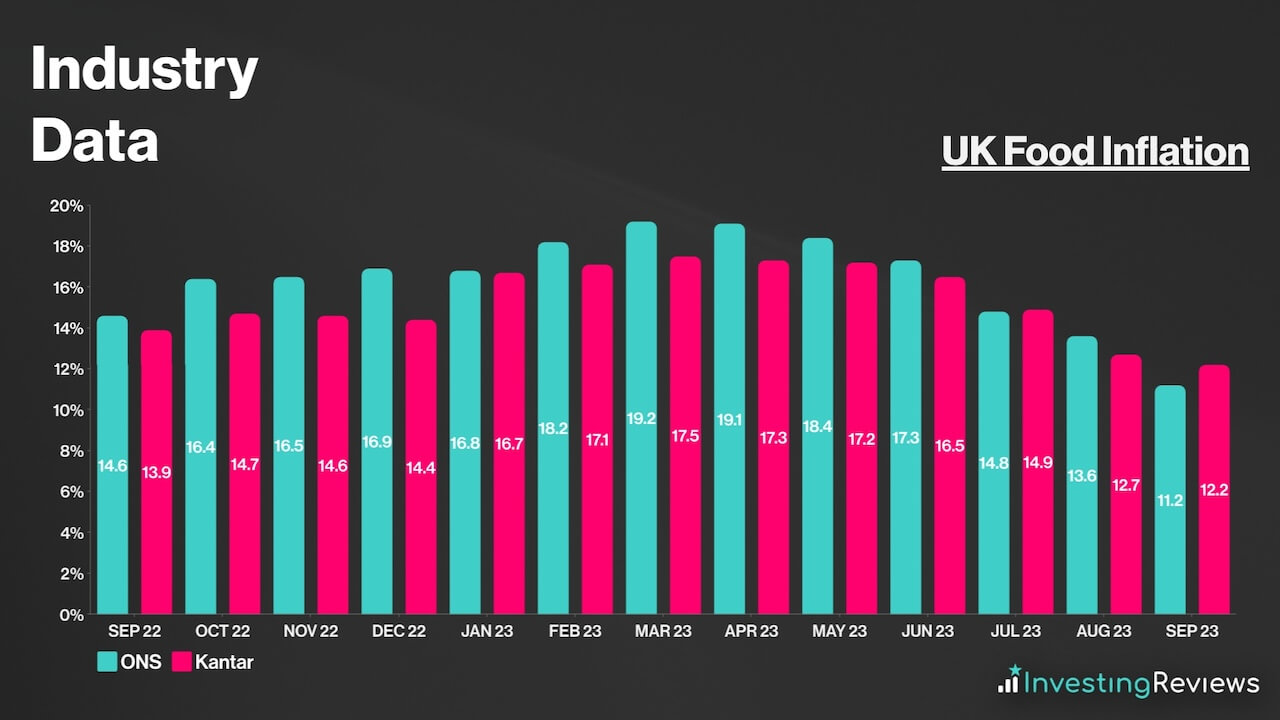
Further exacerbating the issue, the cost-of-living crisis has seen grocery inflation tick up by double digits. As a consequence, customers have been trading down. On the other hand, elevated energy and labour costs continue to bite down on Marks and Spencer’s bottom line.
Marks and Spencer had been paying dividends up till 2019 when it had to pause its payouts due to declining profitability, with the onset of the pandemic not helping its case either.
Either way, prior to its pause, Marks and Spencer shares were known to be favourites amongst dividend investors seeking passive income for their track record and yields. Had it not been for its pause in 2019, M&S would be classified as a dividend aristocrat today.
In its most recent results, the Marks and Spencer board is projected to resume paying a dividend when it releases its interim results in October. This is in line with what analysts are forecasting, with a small payout in FY24 before a slight increase in the following year.
Marks and Spencer shares are currently trading at a discount when compared to their industry competitors. Their adjusted P/E ratio is very much in line with the index average too. What’s more, their P/S ratio sits comfortably below 1. This could indicate tremendous growth potential from its sales, considering it’s sitting below its historical averages.
[stock_market_widget type=”table-quotes” template=”basic” assets=”MKS.L,OCDO.L,SBRY.L,TSCO.L” fields=”name,price_book,price_to_sales_trailing_12_months,pe_ratio,forward_pe_ratio” links=”{‘MKS.L’:{},’OCDO.L’:{},’SBRY.L’:{},’TSCO.L’:{}}” display_header=”true” display_chart=”false” display_currency_symbol=”false” pagination=”false” search=”false” rows_per_page=”5″ sort_field=”logo_name_symbol” sort_direction=”asc” alignment=”left” api=”yf” ]
Among the 19 qualified analysts covering Marks and Spencer shares, the consensus is for Marks and Spencer to grow its top and bottom lines over the next two years, as it continues to adopt a refreshed brand strategy.
| Metrics | FY23 (Reported) | FY24 | FY25 |
|---|---|---|---|
| Statutory Revenue | £11.93bn | £12.70bn | £13.03bn |
| Adjusted Diluted EPS | 17.50p | 18.74p | 20.98p |
Data source: Marks and Spencer, Financial Times
Marks and Spencer shares currently have an average Hold rating from several brokers. With an average price target of 248p, analysts seem to agree that Marks and Spencer shares are close to hitting a peak, with limited upside potential and higher downside risks in the next 12 months.
| Date | Brokerage | Rating | Price Target |
|---|---|---|---|
| 29/9/2023 | Bank of America | Buy | 300p |
| 29/9/2023 | JPMorgan | Sell | 170p |
| 13/9/2023 | Morgan Stanley | Hold | 280p |
| 6/9/2023 | Goldman Sachs | Hold | 255p |
| 31/8/2023 | Shore Capital | Buy | N/A |
| 29/8/2023 | RBC | Hold | 235p |
| 16/8/2023 | Numis | Hold | 250p |
| 16/8/2023 | Deutsche | Buy | 260p |
| 16/8/2023 | Credit Suisse | Buy | 260p |
| 16/8/2023 | Barclays | Buy | 270p |
| 7/6/2023 | UBS | Hold | 200p |
| 25/5/2023 | SocGen | Hold | 190p |
| 18/5/2023 | Citi | Hold | 170p |
| 22/3/2023 | BNP Paribas | Hold | N/A |
| 6/3/2023 | Jefferies | Hold | 160p |
Data source: Market Screener
My price target for Marks and Spencer shares was last updated on 8th November 2023.
| Metrics | Adjusted FY24 (Projected) | Comments | |
|---|---|---|---|
| UK Food |
£7.98bn | c.10.5% growth — higher than long-term average due to food inflation but lower than FY23 due to tapering inflation. Slight premium from improved offerings and new stores. | |
| UK Clothing & Home | £3.93bn | c.7.5% growth — improved style perceptions and market share gains, as well as higher discretionary spending from higher wage growth and lower inflation. | |
| International | £1.11bn | c.5% growth — lower forward provisions for economic guidance, but offset by increased funding and other operating expenses. | |
| Revenue | £13.02bn | ||
| Cost of Sales | £8.46bn | c.65% of revenue — in line with long-term average and lower than FY23 due to lower wholesale costs. | |
| Gross Profit | £4.56bn | ||
| Selling & Administrative Expenses | £3.74bn | c.28.7% of revenue — lower than long-term average as Gist supply chain savings should offset higher wage costs. | |
| Ocado Retail JV and Other Income | -£0.08bn | Costs related to new and excess capacity in Ocado offset one-off accrual release in prior year result. | |
| Operating Profit | £740m | ||
| Finance Income | £120m | Higher interest receivables from higher interest rates offset by lack of adjusted items benefit. | |
| Finance Costs | £200m | Decline in lease liabilities from higher percentage of properties owned with lower interest to pay from repurchase of several medium-term bonds. | |
| Profit Before Tax | £660m | ||
| Taxation | £205m | Underlying Tax Rate of c.31%, in line with H1. | |
| Profit for FY24 | £455m | ||
| Shares in Issue | 2.08bn | Assuming dilution at annualised rate between FY22 and FY23. | |
| Adjusted Diluted EPS | 21.88p | ||
| Price Target | 295p (BUY) | ||
Despite the shares now floating around the average price target amongst analysts, I believe the stock still has further upside to my price target. The retail giant returned to the FTSE 100 last month after four long years, and this is a testament to the amazing work CEO Stuart Machin and co-CEO Katie Bickerstaffe have done since taking the reins of the renowned retailer in May 2020.
The newly appointed board has transformed a dying retailer that lost its spark into a vibrant and exciting business with plenty of potential. And with Machin’s ambition to grow its food market share by 1% annually, M&S could see it overtake its closest peer in Waitrose as soon as 2024.
Like Tesco, M&S is also set to benefit from the increase in discretionary spending. This should see the strong momentum the business has carried from the cost-of-living crisis continue. When paired with the expansion of new and reinvigorated stores and an improved supply chain, the route higher for Marks and Spencer shares is just getting started. Thus, I reiterate my Buy rating.
John Choong, Senior Equity Research Analyst
Please note: John Choong has positions in Marks and Spencer. These stock analysis reports are not personal recommendations or advice and should never be treated as such.
The value of your investments (and any income from them) can go down as well as up and you may not get back the full amount you invested. Past performance is not a reliable indicator of future performance. Investments should be considered over the longer term and should fit in with your overall attitude to risk and financial circumstances.
- Learn how to invest in the FTSE100
- Have you considered transferring your pension?
- Find the best trading platforms