
My Sainsbury’s share price forecast includes a 360-degree examination to determine whether investors should consider this renowned retailer and add the stock to their baskets.
This stock analysis report goes into detail on Sainsbury’s financial position, competitive strengths, industry outlook, valuation metrics, and analysts’ predictions to uncover whether Sainsbury’s shares actually present a golden long-term opportunity.
Read On: To find the Sainsbury’s share price forecast and my price target.
- Sainsbury’s Share Price (LON:SBRY)
- Sainsbury’s Background
- Sainsbury’s Business Model
- Sainsbury’s Earnings Breakdown
- Sainsbury’s Financials
- Sainsbury’s Competitive Advantage
- Sainsbury’s Shortcomings
- What is the Dividend Forecast for Sainsbury’s Shares?
- Are Sainsbury’s Shares Cheap?
- What is the Profit Forecast for Sainsbury’s Shares?
- What is the Sainsbury’s Share Price Forecast?
- What is the Price Target for Sainsbury’s Shares?
- Are Sainsbury’s Shares a Buy, Sell, or Hold?
Sainsbury’s Background
Sainsbury’s, otherwise known as J Sainsbury, is the second-largest supermarket chain in the UK. It operates a group of businesses that include Sainsbury’s itself, Argos, Habitat, Tu, and Nectar. Together with its subsidiaries, Sainsbury’s sells products such as food, fuel, household goods, and various other items through the thousands of stores it operates in the UK and online.
The company is also involved in food and drink wholesaling activities. In addition, it offers banking and insurance services through its financial arm in Sainsbury’s Bank. Further, the firm provides data science, technology, and digital media services through Nectar and its renowned loyalty programme.
Sainsbury’s shares trade on the London Stock Exchange and are constituents of the FTSE 100.
Find Out: How easy it is to buy Sainsbury’s shares in 6 simple steps.
Sainsbury’s Business Model
As a conglomerate, Sainsbury’s makes its money through a variety of revenue streams. The bulk of its sales stems from its retail arm, where it sells groceries, general merchandise, and other household items. On top of that, Sainsbury’s also generates revenue from fuel sales at its forecourts and its financial services arm.
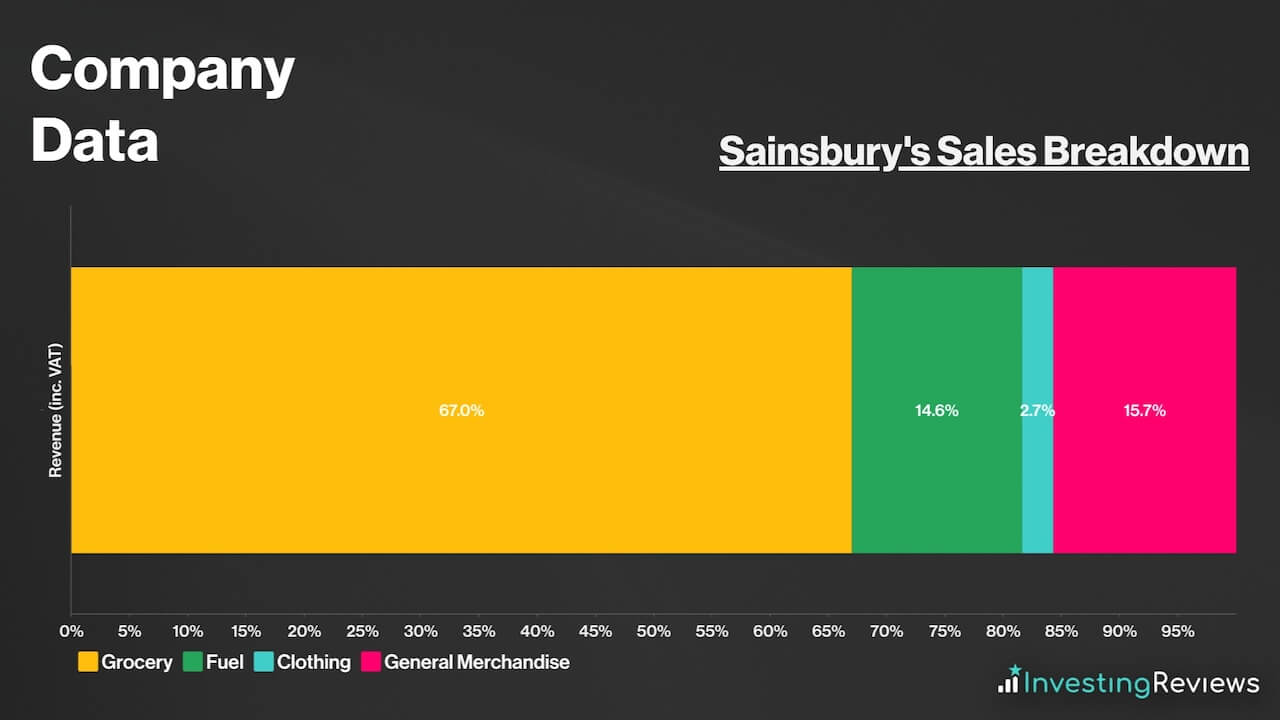
Within its large retail segment, however, the majority of its sales come from groceries and other food products. This is followed by general merchandise, which it sells through its subsidiary, Argos, and fuel sales. A smaller portion of its sales stems from apparel which tends to come from another subsidiary, Tu.
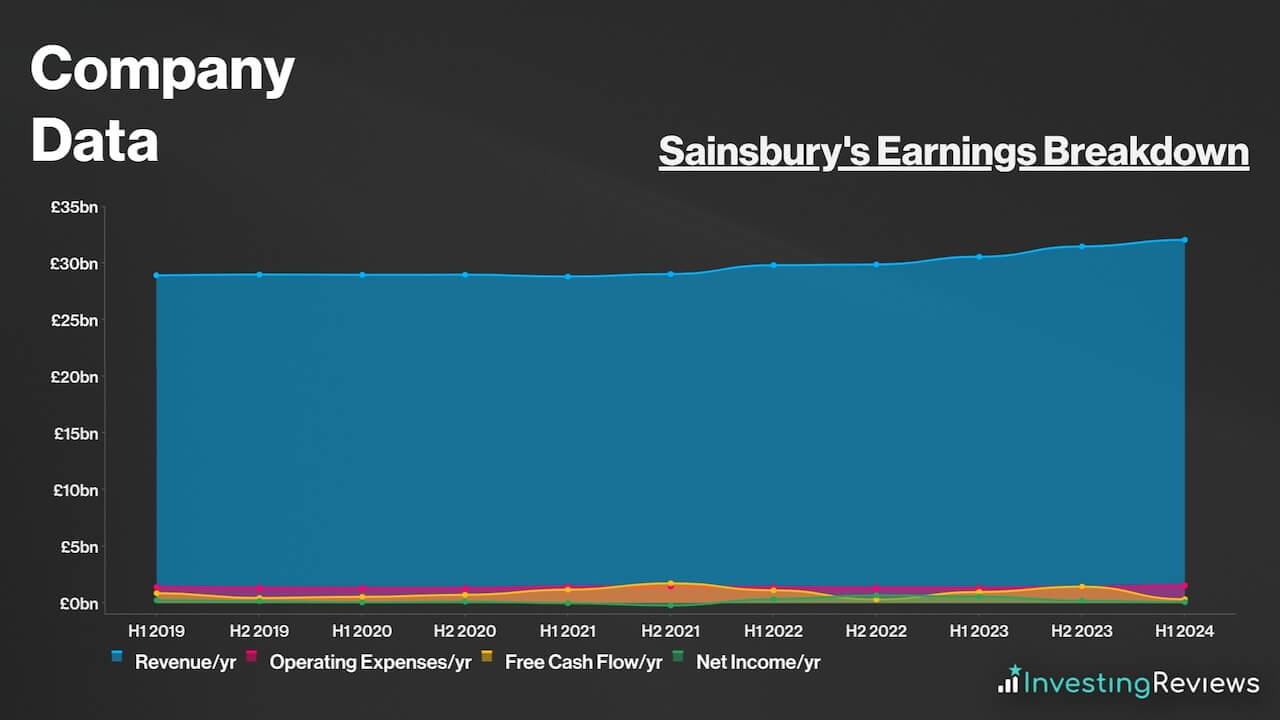
Sainsbury’s Earnings Breakdown
Sainsbury’s operates a retail business model for the most part, and earns its profits from buying items in bulk at wholesale prices, and then selling them to customers at a higher price to turn a profit.
As for its financial services arm, a slightly more complicated business model is involved. Sainsbury’s Bank earns its income through two methods. The first is through net interest income — income generated from assets (interest on customer loans) minus liabilities (interest paid to customer deposits). The second is through fee income, where it collects fees from customers’ credit card spending and foreign currency spreads.
Because most of Sainsbury’s profits stem from its retail business, profit margins are considered to be relatively low. That’s because the business operates on a high-volume basis to earn profits.
Sainsbury’s Financials
On the face of it, Sainsbury’s balance sheet may be off-putting to some as its current liabilities trump its current assets by £3.20bn. Nonetheless, elevated debt levels are considered to be a norm in the retail industry, especially for giant retailers.
This is due to a neat trick where retailers use credit (debt) to purchase fast-moving consumer goods, which tend to sell in 90 days or less. This is categorised as ‘Trade and Other Payables’ on the group’s balance sheet.
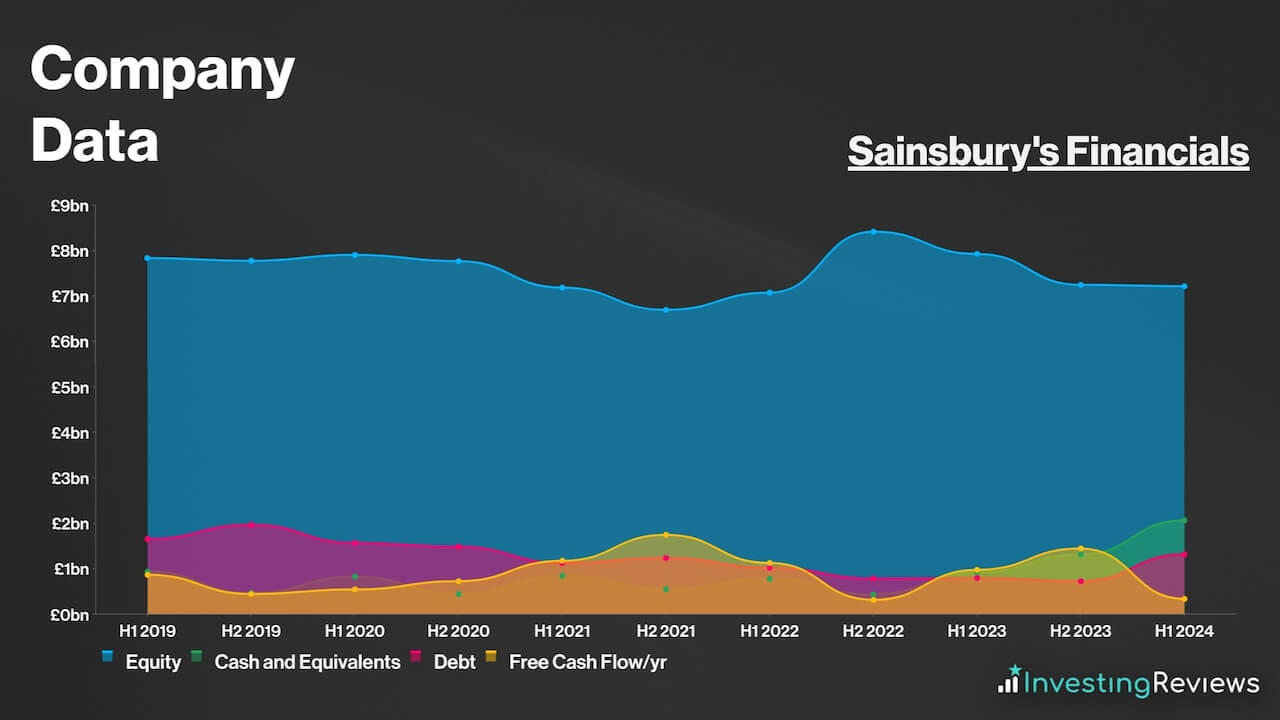
Therefore, it wouldn’t be unreasonable to discount this amount (£5.28bn) from Sainsbury’s current liabilities as they’re more likely than not to meet those obligations given their large customer base. Thus, excluding Sainsbury’s ‘Trade and Other Payables’, its current liabilities then shrink from £11.59bn to £6.32bn, which can be easily covered by its current assets worth £8.39bn.
Upon taking this figure out, Sainsbury’s balance sheet looks a lot healthier, with a debt-to-equity ratio of just 18.2%. This is comparably better than its other local competitors who have much higher debt levels.
Even so, the company still holds £1.32bn worth of debt. Thankfully, Sainsbury’s liquidity and free cash flow can sufficiently cover its short and long-term obligations without fuss. Either way, its debt maturity profile isn’t alarming, with repayments spread out rather evenly over the course of the next decade or so.
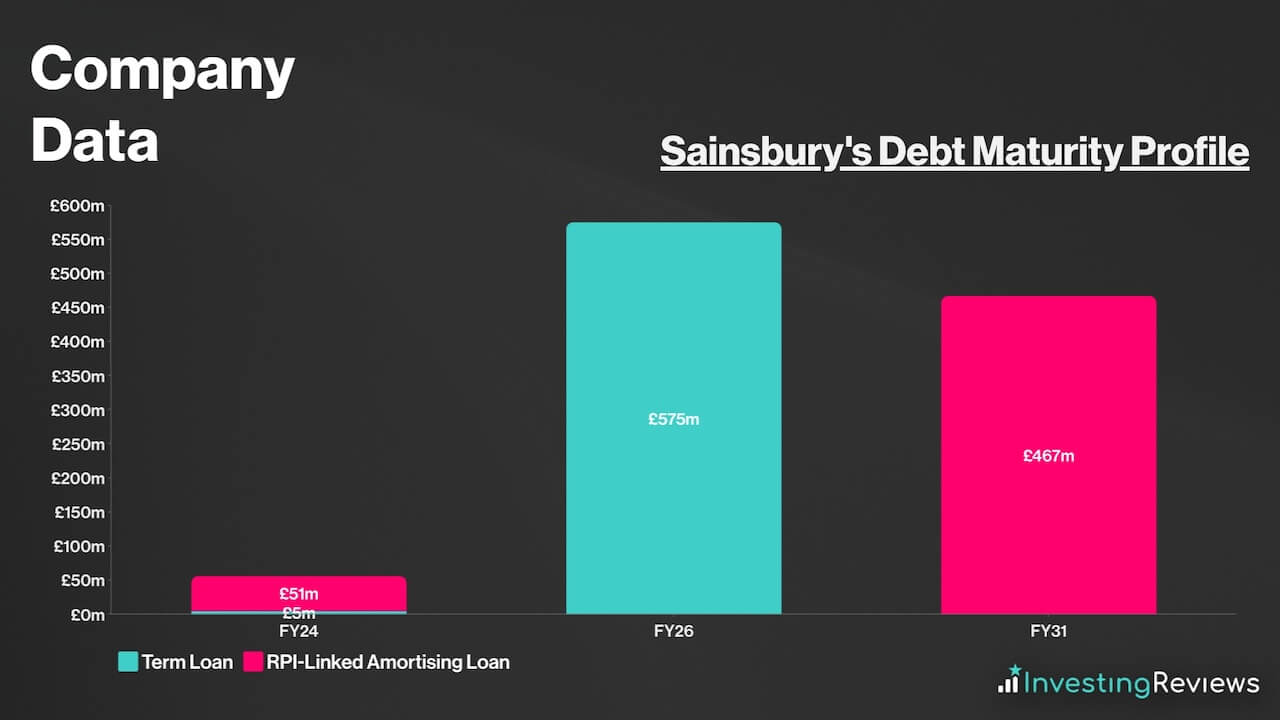
With less than £1bn due over the next decade, Sainsbury’s should have sufficient liquidity to pay off its debt in the coming years, as long as it continues to generate cash at these levels. It’s also worth noting that Sainsbury’s has c.£1.00bn worth of revolving credit and term loan facilities. This means that the retail giant has the option to inject more liquidity into the business if it needs to.
Overall, Sainsbury’s currently has a net debt to EBITDA ratio of 2.6x, which sits on the lower end of its target range of 2.4x to 3.0x. Meanwhile, its fixed charge cover sits at a strong 2.6x, allowing it to sufficiently cover its fixed costs such as leases. For those reasons, it’s safe to say that the retailer’s debt pile is manageable, with the board efficiently utilising capital to generate further value for shareholders.
Sainsbury’s Competitive Advantage
Having an economic moat (competitive advantage) over competitors is crucial in saturated industries such as food and retail, where profit margins aren’t the highest, with low barriers to entry.
As such, Sainsbury’s main competitive advantage is its defensive market share position. Despite being a distant second to the market leader, Tesco, Sainsbury’s has managed to retain its position as the second-largest supermarket in the UK’s grocery market over the past decade and longer. But what really makes the retailer stand out is its unique omnichannel offering through groceries and general merchandise.
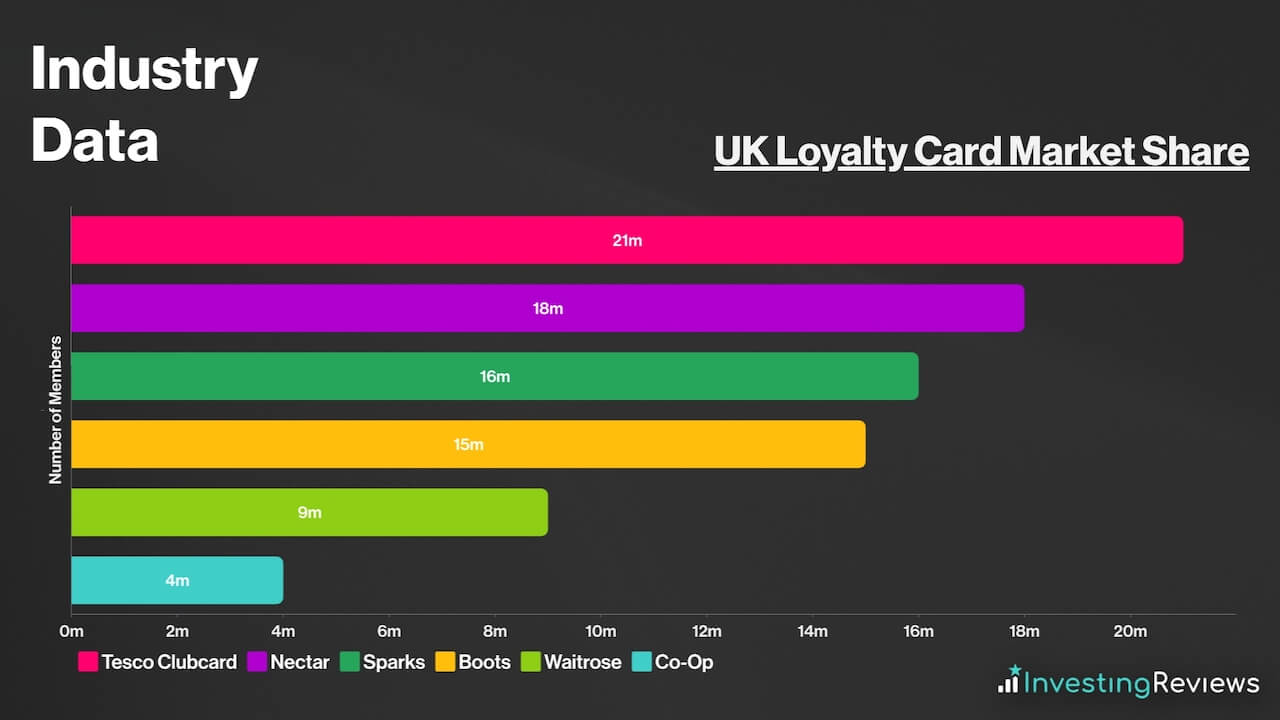
With more than 2,500 Sainsbury’s and Argos stores and collection points across the UK, multiple Sainsbury’s stores can be found in most cities across the country. To complement this, Sainsbury’s has millions of users that are registered for its Nectar loyalty programme. This has grown to a total of 18m members, with 14m digital users across the UK.
Due to its massive user base, Sainsbury’s leverages this by offering perks to those who own a Nectar card to attract and retain customers who shop with them. Shoppers can get a number of personalised offers based on their shopping habits. Combine that with Nectar’s partners, where users can gather Nectar points, and one could make the argument that the orange supermarket’s user proposition is better than its peers.
Sainsbury’s Shortcomings
Despite being such a giant in the retail space, Sainsbury’s also has its fair share of weaknesses. This could put investors off when buying Sainsbury’s shares.
For one, its profit margins are extremely slim, ranging from 1% to 3% on a good year. This means that a black swan event like an outbreak linked to its supply chain, for example, could plunge Sainsbury’s into unprofitability. And in the current cost-of-living crisis, net profits have declined to less than 1%, showing how delicate its margins are.
Sainsbury’s also suffers from a phenomenon called, ‘the valley of death’. In other words, Sainsbury’s lacks a special offering that would effectively draw customers to it, as it doesn’t necessarily offer the best value (Aldi/Lidl) or quality (Waitrose/Marks and Spencer). As a result, it’s been losing market share to other players over the past decade, while Tesco continues to expand its dominance.
More importantly, especially for dividend investors, its current dividend yield lags the FTSE’s average. Considering that there are other blue-chip names out there with better prospects and higher dividends, this could dampen the investment case for Sainsbury’s shares.
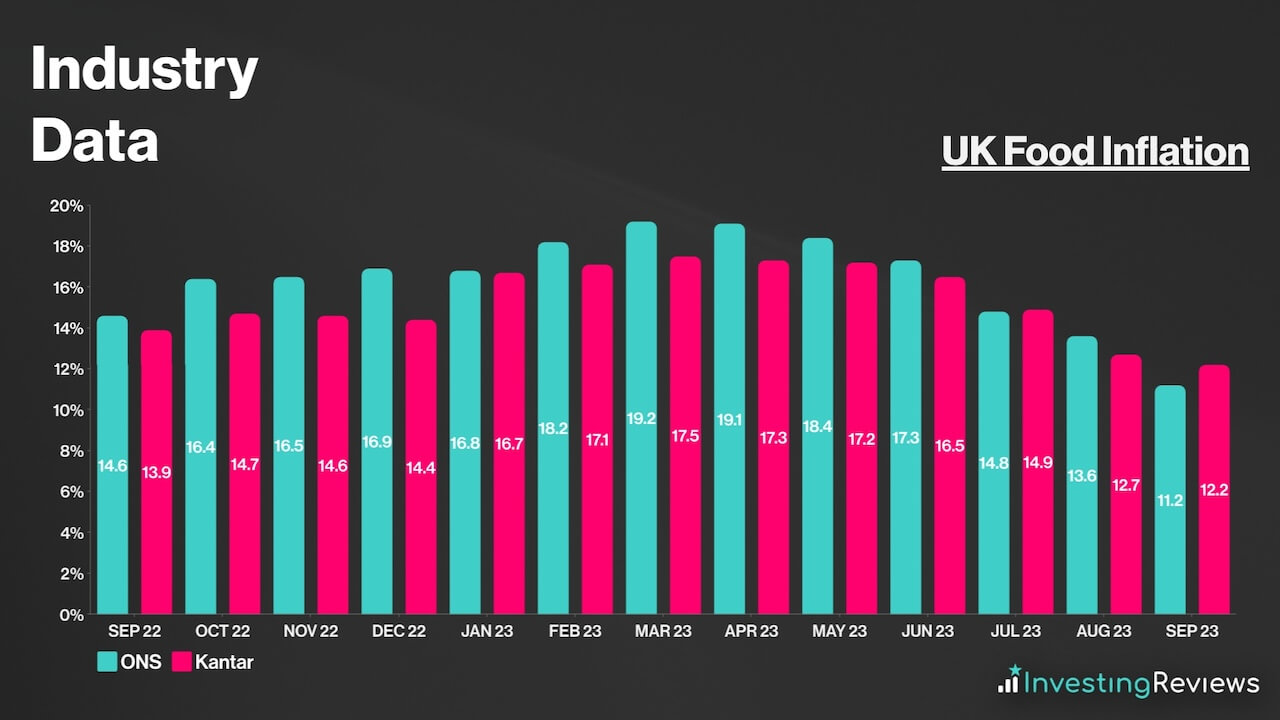
Further exacerbating the issue, the cost-of-living crisis has seen grocery inflation tick up to double digits. As a consequence, customers have been trading down. On the other hand, elevated energy and labour costs continue to bite down on Sainsbury’s bottom line.
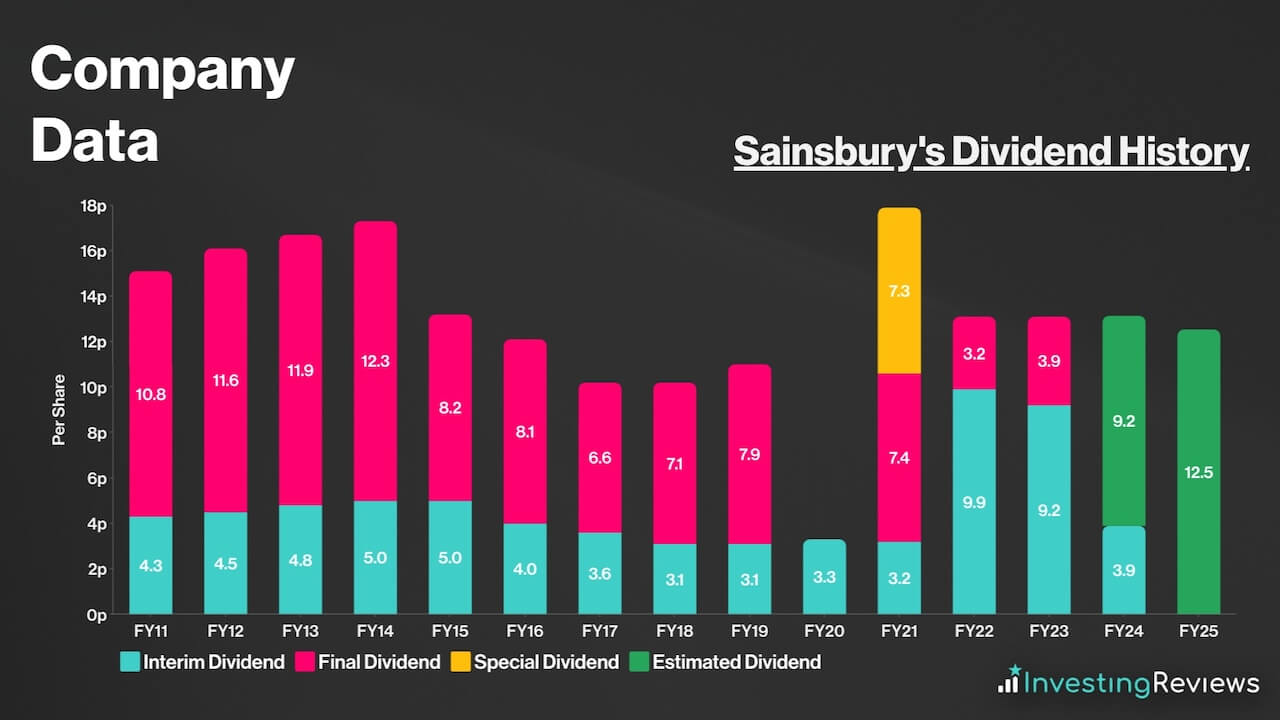
Sainsbury’s pays a dividend and has been paying dividends for decades. This makes it a dividend aristocrat.
For that reason, Sainsbury’s shares are known for their ‘safety’, and are favourites among dividend investors seeking passive income despite the lower-than-average yield. The stock’s payouts may have tumbled in 2017 and stagnated for a while, but recent increases in dividends hold some promise that payouts could improve further in the future. Moreover, its current dividend yield is well covered at 1.8x.
Sainsbury’s is expecting to continue paying a dividend for the foreseeable future. But currently, analysts are forecasting dividends to decline slightly over the next two years.
Sainsbury’s shares are currently trading at a discount when compared to their industry competitors, and are in line on an adjusted basis. Their adjusted P/E ratio is very much in line with the index average too. What’s more, their P/S ratio sits comfortably below 1, which could indicate tremendous growth potential from its sales.
Among the 10 qualified analysts covering Sainsbury’s shares, the consensus is for Sainsbury’s to grow its revenue over the next two years, with a slight boost from higher inflation. That said, they’re forecasting a slight decline in profits for FY24, clamped down by high energy and food costs with potentially higher capital expenditures, before rebounding in FY25.
| Metrics | FY23 (Reported) | FY24 | FY25 |
|---|---|---|---|
| Revenue (ex.VAT) | £31.49bn | £32.43bn | £32.86bn |
| Underlying Basic EPS | 23.0p | 20.75p | 22.08p |
Data source: Sainsbury’s, Financial Times
Sainsbury’s shares currently have an average Hold rating from several brokers. With an average price target of 285p, analysts seem to agree that Sainsbury’s shares are close to hitting a peak, with limited upside potential and higher downside risks in the next 12 months.
| Date | Brokerage | Rating | Price Target |
|---|---|---|---|
| 3/11/2023 | Jefferies | Hold | 300p |
| 3/11/2023 | Barclays | Buy | 310p |
| 5/9/2023 | JPMorgan | Sell | 238p |
| 5/7/2023 | UBS | Hold | 275p |
| 27/6/2023 | Shore Capital | Buy | N/A |
| 19/6/2023 | Bernstein | Hold | 270p |
| 7/3/2023 | Morgan Stanley | Sell | 250p |
| 22/5/2023 | Citi | Hold | 295p |
| 28/4/2023 | Bank of America | Sell | 215p |
| 21/3/2023 | BNP Paribas | Buy | 300p |
| 6/1/2023 | Goldman Sachs | Hold | 225p |
Data source: Market Screener
My price target for Sainsbury’s shares was last updated on 3rd November 2023.
| Metrics | Underlying FY24 (Projected) | Comments | |
|---|---|---|---|
| Revenue (ex. VAT) | £33.06bn | c.5% growth — higher than long-term average due to food inflation but lower than FY23 due to tapering inflation and lower fuel prices. | |
| Cost of Sales | £30.32bn | c.91.7% of revenue — in line with long-term average and lower than FY23 due to lower wholesale food costs. | |
| Impairments on Financial Assets | £0.11bn | In line with H1 trends. | |
| Gross Profit | £2.63bn | ||
| Administrative Expenses | £1.62bn | c.4.9% of revenue — higher wage costs to be offset by cost-saving programme. | |
| Other Income | £0.03bn | Financial Services profits expected to be lower than last year. | |
| Operating Profit | £1.04bn | ||
| Finance Income | £20m | Higher interest from deposits. | |
| Finance Costs | £350m | Higher rate environment resulting in higher bond yields and lease liabilities. | |
| Profit Before Tax | £710m | Slightly higher than guidance of £670m to £700m. | |
| Taxation | £202m | Underlying Tax Rate of c.28.5%, roughly in line with guidance of underlying tax rate of 29%. | |
| Profit for FY24 | £508m | ||
| Shares in Issue | 2.40bn | Assuming dilution at annualised rate between FY22 and FY23. | |
| Adjusted Diluted EPS | 21.17p | ||
| Price Target | 275p (HOLD) | ||
Sainsbury’s has certainly made a name for itself, as it attempts to cement itself as part of the big three supermarket PLCs that continue to outperform its industry peers. The company’s vision in putting food at the forefront of its transformation programme is beginning to pay dividends as the orange grocer is now taking market share on the volume front — a far cry from where it was just a year ago.
As such, it’s safe to say that the board’s moves to offer incredible value through improved product propositions and a refreshed Nectar programme through Nectar Prices seems to be working, and should continue to benefit both volumes and its top line in the short to medium term. Paired with an improved cost structure and the deleveraging of its lease liabilities, and JS seems to be carving a promising path out for itself.
Nonetheless, management seems to be going down the route of chasing volumes which may come at the expense of margins. While this is by no means a disadvantage, it remains to be seen whether Sainsbury’s has a strong enough proposition to capture enough volume to offset the decline in profitability. Thus, I retain a Hold on the stock for now, with a cautious outlook that its bottom line might not tick up as meaningfully as the market expects it to.
John Choong, Senior Equity Research Analyst
Please note: John Choong has no positions in Sainsbury’s. These stock analysis reports are not personal recommendations or advice and should never be treated as such.
The value of your investments (and any income from them) can go down as well as up and you may not get back the full amount you invested. Past performance is not a reliable indicator of future performance. Investments should be considered over the longer term and should fit in with your overall attitude to risk and financial circumstances.