
My Tesco share price forecast includes a 360-degree examination to determine whether investors should consider this renowned retailer and add the stock to their baskets.
This stock analysis report goes into detail on Tesco’s financial position, competitive strengths, industry outlook, valuation metrics, and analysts’ predictions to uncover whether Tesco shares actually present a golden long-term opportunity.
Read On: To find the Tesco share price forecast and my price target.
- Tesco Share Price (LON:TSCO)
- Tesco Background
- Tesco Business Model
- Tesco Earnings Breakdown
- Tesco Financials
- Tesco Competitive Advantage
- Tesco Shortcomings
- What is the Dividend Forecast for Tesco Shares?
- Are Tesco Shares Cheap?
- What is the Profit Forecast for Tesco Shares?
- What is the Tesco Share Price Forecast?
- What is the Price Target for Tesco Shares?
- Are Tesco Shares a Buy, Sell, or Hold?
Tesco Background
Tesco is the biggest retailer and supermarket in the UK. It also operates in the Republic of Ireland, Czech Republic, Slovakia, Hungary, and has joint ventures in parts of Asia.
It operates a group of businesses that include Tesco itself, Booker, One Stop, and Dunnhumby. Together with its subsidiaries, Tesco sells products such as food, fuel, household goods, and various other items through the thousands of stores it operates, and online.
The company is also involved in food and drink wholesaling activities. In addition, it offers banking and insurance services in the UK. Further, the firm provides data science, technology, software, and consultancy services.
Tesco shares trade on the London Stock Exchange and are constituents of the FTSE 100.
Find Out: How easy it is to buy Tesco shares in 6 simple steps.
Tesco Business Model
As a conglomerate, Tesco makes its money through a variety of revenue streams. The bulk of its sales stems from its retail arm, where it sells food products, clothes, and other household items. On top of that, Tesco also generates revenue from fuel sales at its forecourts and its banking arm.
On the geographical front, the company predominantly operates in the UK and Republic of Ireland, where it earns most of its money from. However, Tesco has operations in Slovakia, Czech Republic, Hungary, as well as joint ventures in several Asian countries like India. It also classifies its wholesale distributor business (Booker) as a separate entity when tabulating revenue.
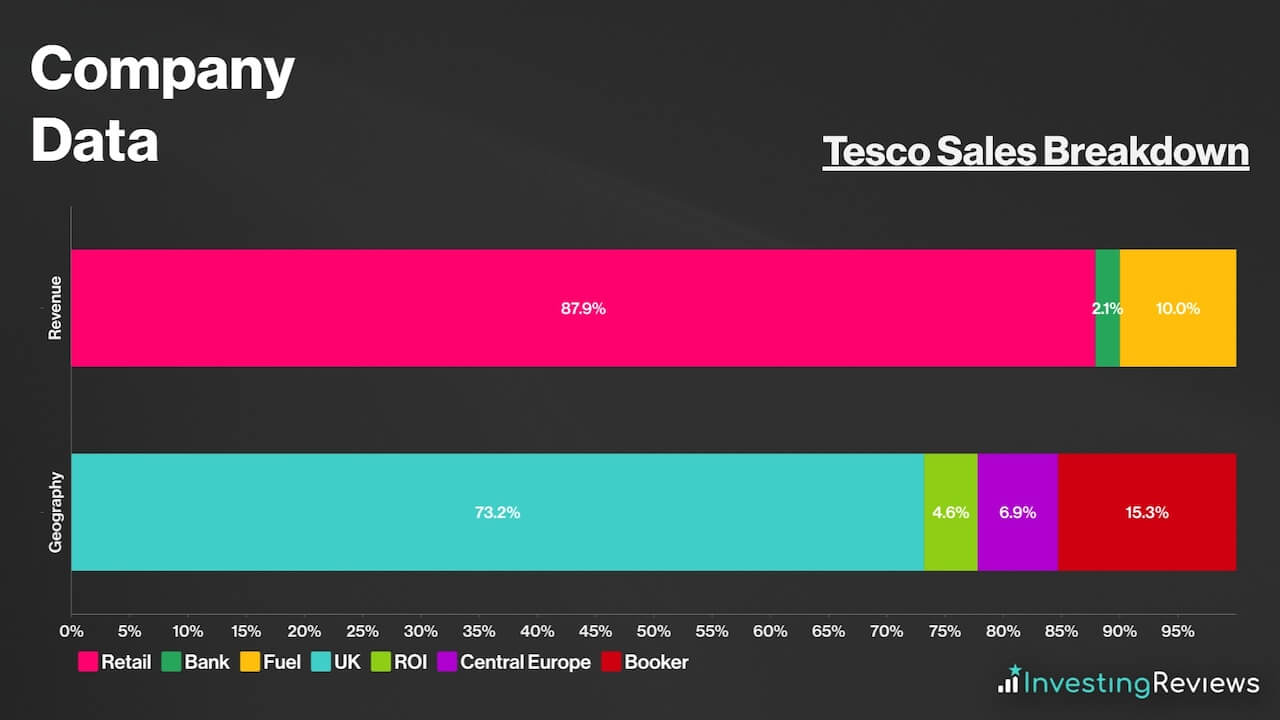
Within its large retail segment, however, the majority of its sales come from groceries and other food products. Its clothing (F&F) and neighbourhood convenience (One Stop) businesses are also included within this category, but make up a smaller percentage of total retail sales.
Tesco Earnings Breakdown
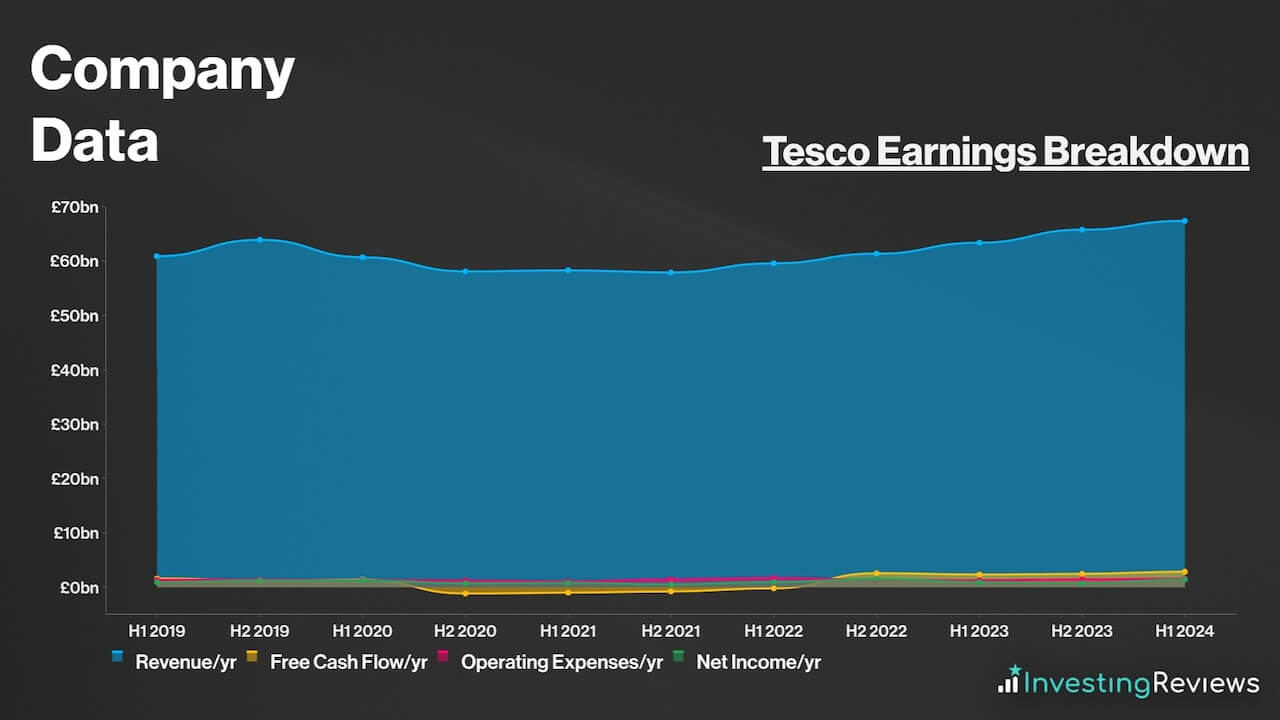
Tesco operates a retail business model for the most part, and earns its profits from buying items in bulk at wholesale prices, and then selling them to customers at a higher price to turn a profit.
As for its banking arm, a slightly more complicated business model is involved. Tesco Bank earns its income through two methods. The first is through net interest income — income generated from assets (interest on customer loans) minus liabilities (interest paid to customer deposits). The second is through fee income, where it collects fees from customers’ credit card spending and foreign currency spreads.
Because most of Tesco’s profits stem from its retail business, profit margins are considered to be relatively low. That’s because the business operates on a high-volume basis to earn profits.
Tesco Financials
On the face of it, Tesco’s balance sheet may be off-putting to some as its current liabilities trump its current assets by £4.99bn. Nonetheless, this is considered to be a norm in the retail industry, especially for giant retailers.
This is due to a neat trick where retailers use credit (debt) to purchase fast-moving consumer goods, which tend to sell in 90 days or less. This is categorised as “Trade and Other Payables” on the group’s balance sheet.
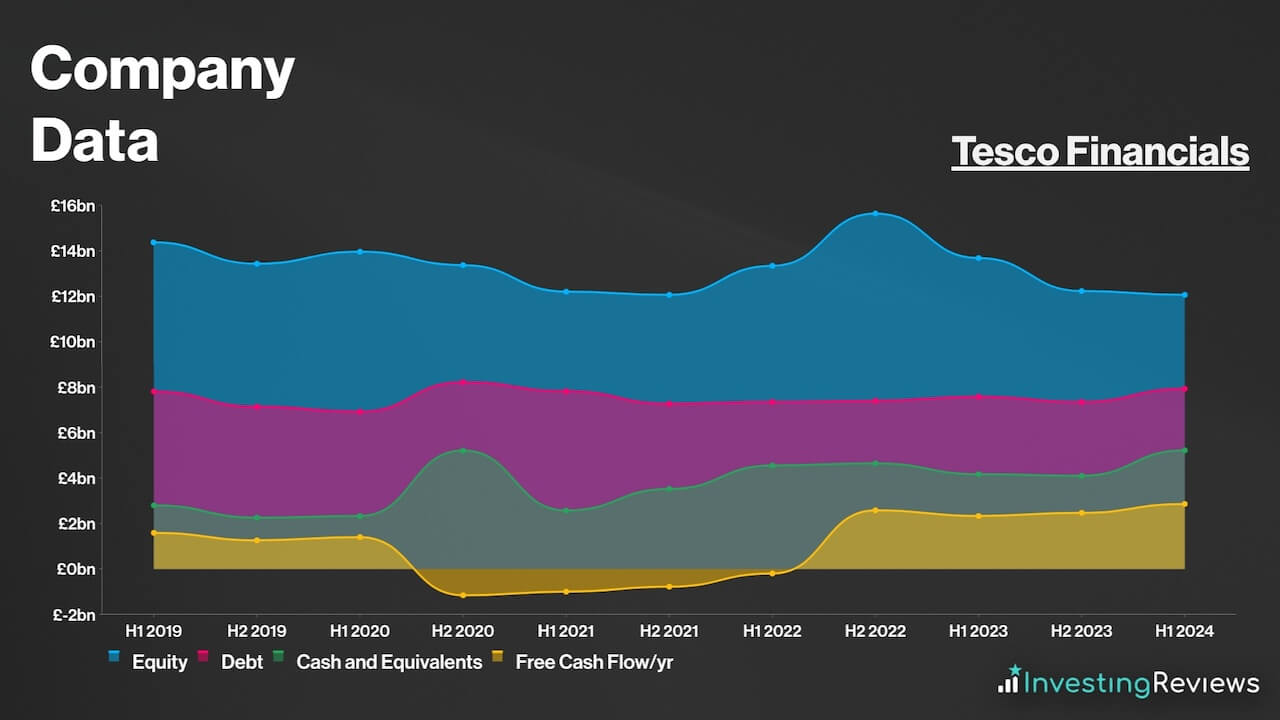
Therefore, it wouldn’t be unreasonable to discount this amount (£10.59bn) from Tesco’s current liabilities as they’re more than likely to meet these obligations given their large customer base. Thus, excluding Tesco’s “Trade and Other Payables”, its current liabilities shrink from £18.96bn to £8.37bn, and can be easily covered by its current assets worth £13.97bn.
Upon taking this figure out, Tesco’s balance sheet looks a lot healthier, with a debt-to-equity ratio of 66%. This is comparably better than many other FTSE constituents who have much higher debt levels.
Even so, there still remains a debt pile worth £7.93bn, which the retail giant’s liquidity and free cash flow can’t sufficiently cover all at once. Either way, its debt maturity profile isn’t alarming, with repayments spread out rather evenly over the course of the next decade or so.
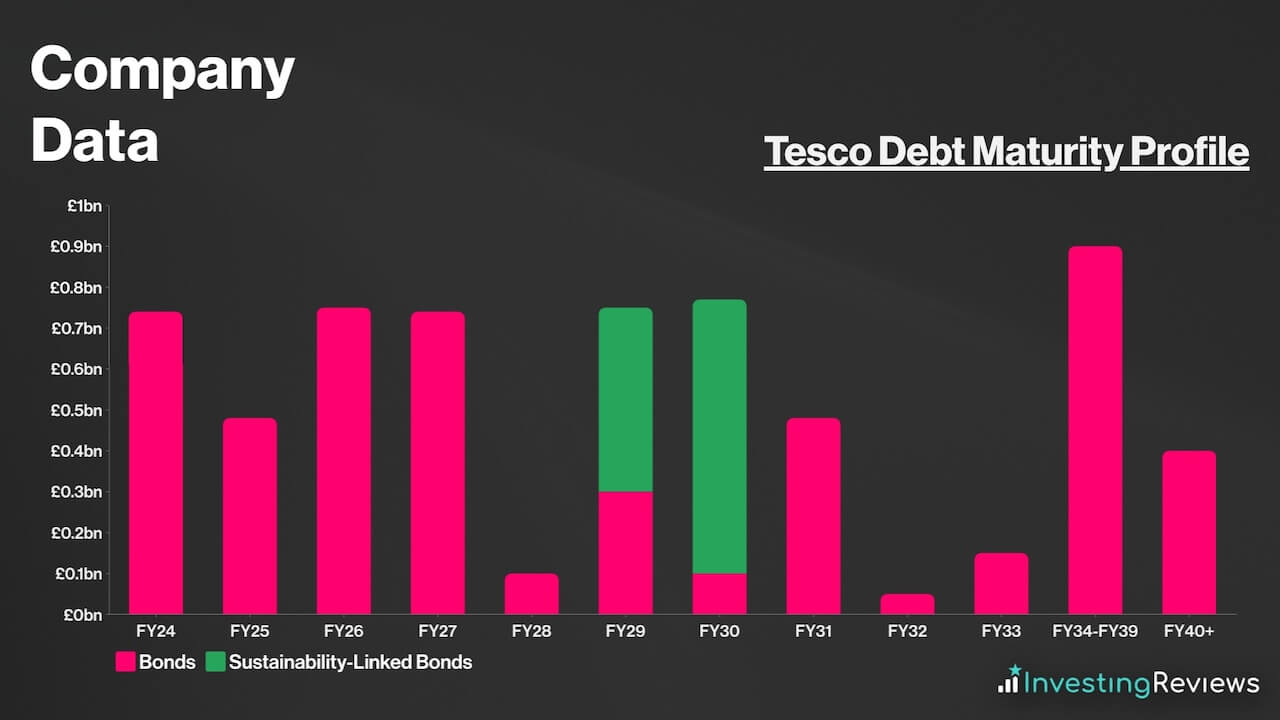
With less than £1bn due per year, over the next decade, Tesco should have sufficient liquidity to pay off its debt in the coming years, as long as it continues to generate cash at these levels. It’s also worth noting that Tesco has £2.50bn worth of undrawn committed facilities. This means that it has the option to inject more liquidity into the business if it needs to.
Overall, Tesco currently has a net debt to EBITDA ratio of 2.3x, which sits on the lower end of its target range of 2.3x to 2.8x. Meanwhile, its fixed charge cover sits at a strong 3.6x. For those reasons, it’s safe to say that the retailer’s debt pile is manageable, as the board continues to efficiently utilise capital and generate further value for shareholders.
Tesco Competitive Advantage
Having an economic moat (competitive advantage) over competitors is crucial in saturated industries such as food and retail, where profit margins aren’t the highest, with low barriers to entry.
As such, Tesco’s main competitive advantage is its dominant market share. The Welwyn-based corporation takes up the lion’s share of the UK’s grocery market, with its closest competitor, Sainsbury‘s miles behind.
With approximately 3,500 stores in the UK, multiple Tesco stores can be found in every city across the country, cementing its place in customers’ minds as the go-to supermarket. To complement this, Tesco has millions of households that are registered for its Clubcard loyalty programme. This has grown to a total of 21m active households in the UK, with 14m app users across all countries.
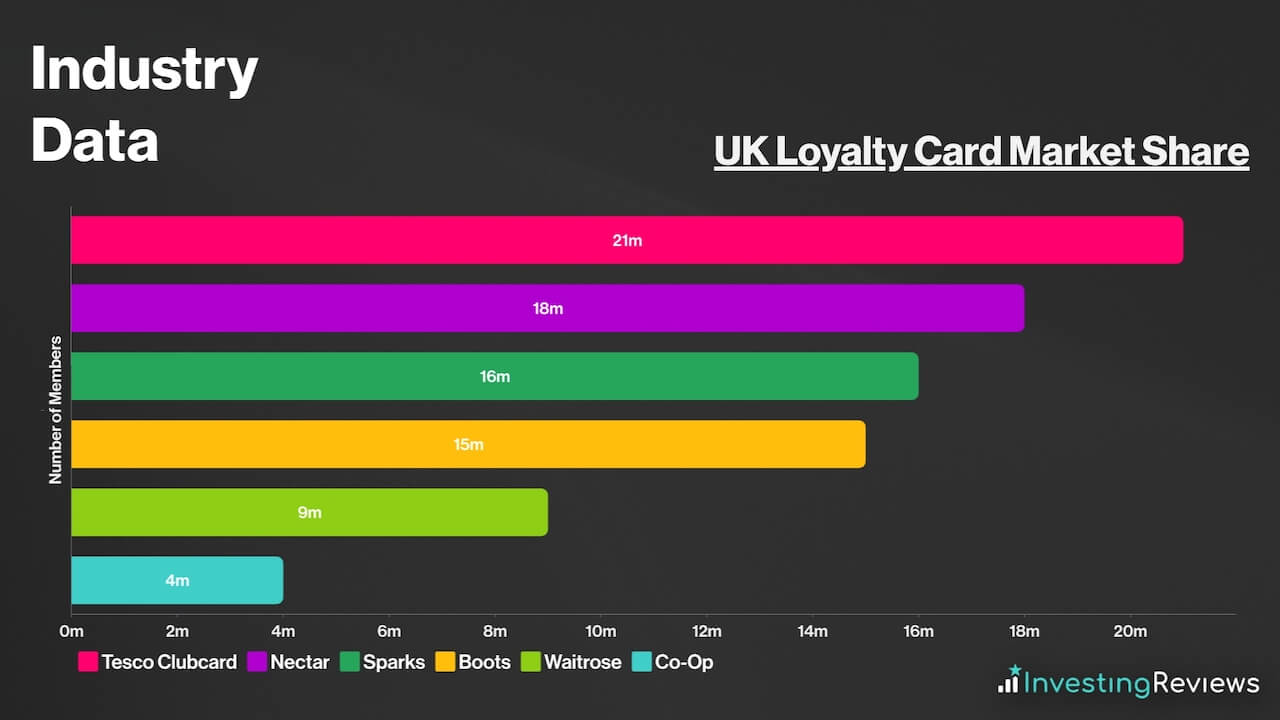
Due to its massive user base, Tesco leverages this by offering perks to those who own a Clubcard to attract customers to shop with them. Aside from redeeming points for vouchers, shoppers can also get exclusive discounts of up to 50% on a wide array of items by using the loyalty scheme. As a result, the Clubcard is by far, the most appealing loyalty programme in Great Britain.
Not only that, the enterprise is moving into the advertising space. CEO Ken Murphy sees a big opportunity through media to capture more revenue through advertising campaigns in the medium term. Currently, there are advertising screens in stores, running over 120 campaigns. And with the new integrated, all-in-one Tesco app, over 300 suppliers have also signed up to get their products sponsored in searches.
Tesco Shortcomings
Despite being such a giant in the retail space, Tesco also has its fair share of weaknesses. This could put investors off when buying Tesco shares.
For one, its profit margins are extremely slim, ranging from 1% to 3% in a good year. This means that a black swan event like an outbreak linked to its supply chain, for example, could plunge Tesco into unprofitability. And in the current cost-of-living crisis, net profits have declined to just 1%, showing how delicate its margins are.
More importantly, especially for dividend investors, its current dividend yield lags the FTSE’s average. Considering that there are other blue-chip names out there with better prospects and higher dividends, this could dampen the buy case for Tesco shares.
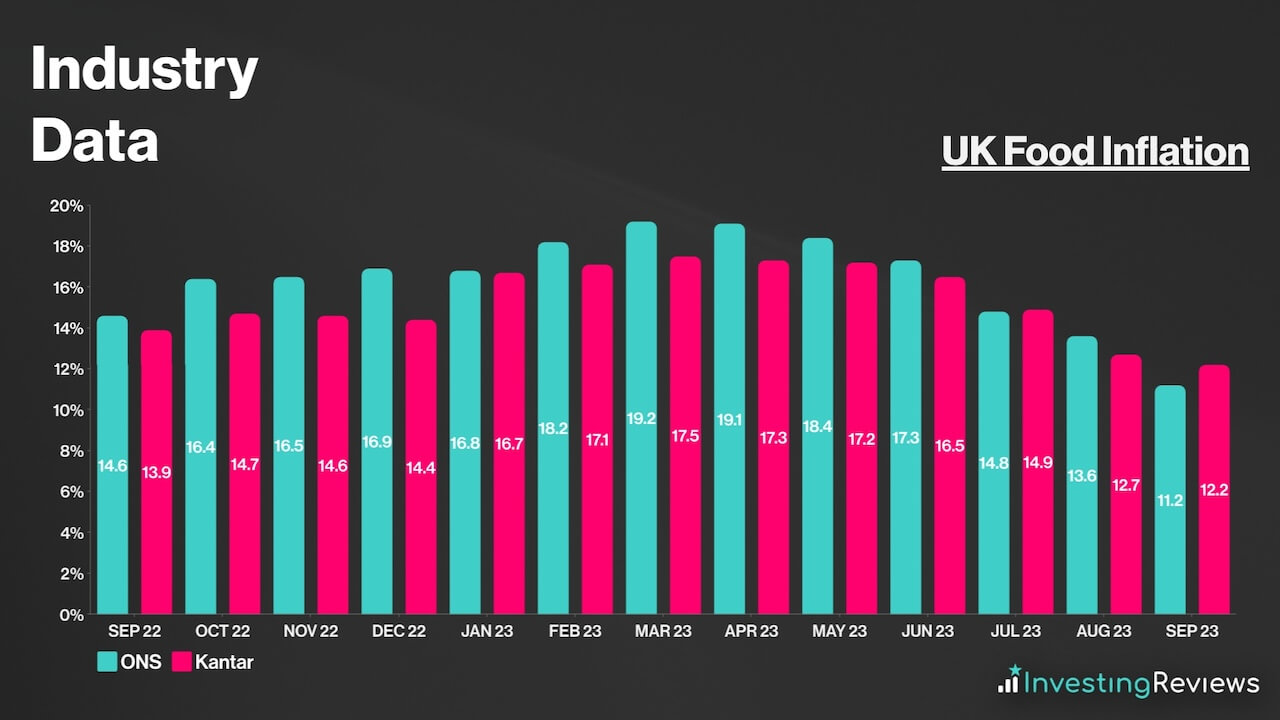
Further exacerbating the issue, the cost-of-living crisis has seen grocery inflation tick up by double digits. As a consequence, customers have been trading down. On the other hand, elevated energy and labour costs continue to bite down on Tesco’s bottom line.
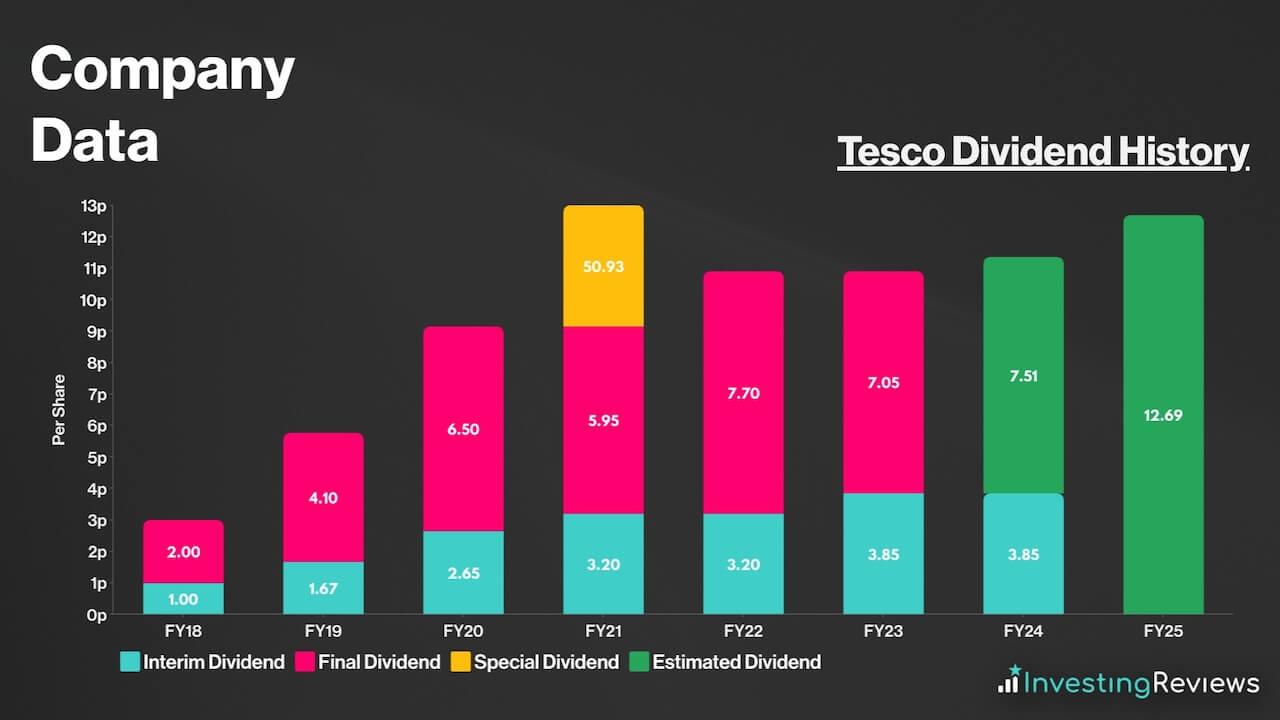
Tesco pays a dividend and has been paying dividends over the last 20 years and longer. This would make it a dividend aristocrat had it not been for the exceptions of 2015 and 2016, when it halted payouts. The conglomerate reported massive losses at that time, which was a result of an accounting scandal and a food poisoning outbreak.
Otherwise, Tesco shares have been a favourite among dividend investors seeking passive income. This is due to the stock’s growing payouts over the years along with the organisation’s commitment to having a progressive dividend. In addition to that, its dividends are well covered at 2.0x.
Tesco is expecting to continue paying a dividend for the foreseeable future. Currently, analysts are forecasting dividends to rise over the next two years.
Tesco shares are currently trading at a discount when compared to their industry competitors, and are in line on an adjusted basis. Their adjusted P/E ratio is very much in line with the index average too. What’s more, their P/S ratio sits comfortably below 1, which could indicate tremendous growth potential from its sales.
Among the 14 qualified analysts covering Tesco shares, the consensus is for Tesco to grow its top and bottom lines over the next two years, as it recovers from high costs during the cost-of-living crisis with a return to higher discretionary spending.
| Metrics | FY23 (Reported) | FY24 | FY25 |
|---|---|---|---|
| Revenue (ex.VAT) | £65.76bn | £68.44bn | £69.79bn |
| Adjusted Diluted EPS | 21.85p | 23.39p | 25.11p |
Data source: Tesco, Financial Times
Tesco shares currently have an average Buy rating from several brokers. With an average price target of 320p, analysts seem to agree that there’s upside potential for Tesco shares over the next 12 months.
| Date | Brokerage | Rating | Price Target |
|---|---|---|---|
| 5/10/2023 | JPMorgan | Hold | 240p |
| 5/10/2023 | Jefferies | Buy | 350p |
| 5/10/2023 | Bernstein | Buy | 320p |
| 5/10/2023 | UBS | Buy | 315p |
| 4/10/2023 | Barclays | Buy | 335p |
| 20/6/2023 | HSBC | Buy | 330p |
| 16/6/2023 | Shore Capital | Buy | N/A |
| 29/3/2023 | Morgan Stanley | Buy | 296p |
Data source: Market Screener
My price target for Tesco shares was last updated on 5th October 2023.
| Metrics | Adjusted FY24 (Projected) | Comments | |
|---|---|---|---|
| Retail | £68.21bn | c.5.5% growth — higher than long-term average due to food inflation but lower than FY23 due to tapering inflation and lower fuel prices. | |
| Tesco Bank Interest Income | £0.86bn | c.60% growth — high deposit inflows seen in H1 should taper off as rates peak and normalise, thereby limiting growth in H2. | |
| Insurance | £0.46bn | c.50% growth — high levels of renewals and growth in new business volumes, owing to competitive pricing. | |
| Revenue (ex. VAT) | £69.53bn | ||
| Cost of Sales | £63.78bn | c.93.5% of retail revenue — lower than FY23 due to lower wholesale costs and improved product mix. | |
| Insurance Service Expenses | £0.42bn | c.92% of insurance revenue — in line with H1. | |
| Net Expenses from Reinsurance Contracts | £0.04bn | c.8% of insurance revenue. | |
| Impairments from Financial Assets | £0.07bn | Based on H1 and improving economic outlook. | |
| Gross Profit | £5.22bn | ||
| Administrative Expenses | £2.29bn | c.3.3% of revenue — slightly higher than FY23 due to higher wage costs, balanced out by restructuring efforts. | |
| Operating Profit | £2.93bn | ||
| Income From JVs | £10m | ||
| Finance Income | £250m | Higher interest receivables from higher interest rates. | |
| Finance Costs | £850m | Decline in lease liabilities from higher percentage of properties owned to offset interest to pay from issuance of new bonds in February. | |
| Profit Before Tax | £2.34bn | ||
| Taxation | £608m | Effective Tax Rate of c.26%, in line with guidance. | |
| Profit for FY24 | £1.73bn | ||
| Shares in Issue | 7.15bn | Buyback of £750m. | |
| Adjusted Diluted EPS | 24.20p | ||
| Price Target | 315p (BUY) | ||
“The current macroeconomic landscape may present headwinds to meaningful earnings growth in the near term. However, encouraging wage growth and robust employment should see margin tailwinds begin to pick up as trading down decreases, As a result, a positive product mix should begin to develop with price locks and the retailer’s open book contract policy with most suppliers playing in its favour.
Plus, Tesco has shown its agility in being able to exit unprofitable markets while capitalising on higher-quality ones. Given the uptick in investments in digital advertising, Finest products, and store refreshes, investors can expect an attractive return on capital employed (RoCE) in the years to come.
With an incredible moat, a progressive dividend, and share buybacks, investors should find comfort in some downside protection as well. Considering net debt/EBITDA is now also at the lower end of the group’s allowance, bigger share buybacks wouldn’t be a surprise moving forward too, and would do EPS wonders. For all those reasons, I reiterate my Buy rating with an upgraded price target of 315p from 300p.”
John Choong, Senior Equity Research Analyst
Please note: John Choong has no positions in Tesco. These stock analysis reports are not personal recommendations or advice and should never be treated as such.
The value of your investments (and any income from them) can go down as well as up and you may not get back the full amount you invested. Past performance is not a reliable indicator of future performance. Investments should be considered over the longer term and should fit in with your overall attitude to risk and financial circumstances.
- Learn how to invest in the FTSE100
- Have you considered transferring your pension?
- Find the best trading platforms