
My Unilever share price forecast includes a 360-degree examination to determine whether investors should consider investing in the diversified consumer goods giant.
This stock analysis report goes into detail on Unilever’s financial position, competitive strengths, industry outlook, valuation metrics, and analysts’ predictions to uncover whether Unilever shares actually present a golden long-term opportunity.
Read On: To find the Unilever share price forecast and my price target.
- Unilever Share Price (LON:ULVR)
- Unilever Background
- Unilever Business Model
- Unilever Earnings Breakdown
- Unilever Financials
- Unilever Competitive Advantage
- Unilever Shortcomings
- What is the Dividend Forecast for Unilever Shares?
- Are Unilever Shares Cheap?
- What is the Profit Forecast for Unilever Shares?
- What is the Unilever Share Price Forecast?
- What is the Price Target for Unilever Shares?
- Are Unilever Shares a Buy, Sell, or Hold?
[stock_market_widget type=”card” template=”basic2″ assets=”ULVR.L” display_currency_symbol=”false” style=”font-size: 1.0rem” api=”yf”]
Unilever Background
Unilever is a diversified consumer goods company. Founded just weeks before the Wall Street Crash of 1929, the Anglo-Dutch business is not far away from its centenary year. Today, Unilever has a global footprint that spans 190 countries and a market cap just shy of £100bn.
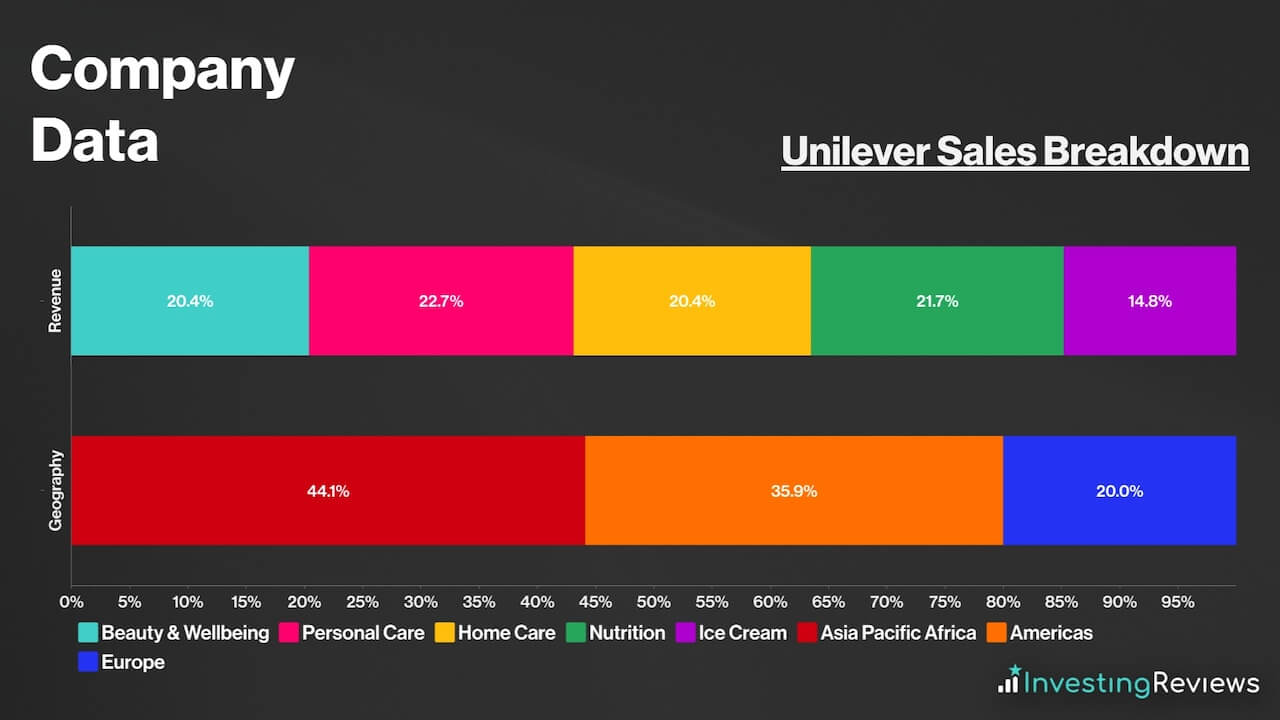
The conglomerate has five main divisions. These include Beauty & Wellbeing, Personal Care, Home Care, Nutrition, and Ice Cream. Across these groups, Unilever owns hundreds of brands in its trade mark portfolio. Household names include Dove, Vaseline, Ben & Jerry’s, Pot Noodle, and Hellmann’s.
Unilever shares trade on the London Stock Exchange and are constituents of the FTSE 100.
Find Out: How easy it is to buy Unilever shares in 6 simple steps.
Unilever Business Model
As a conglomerate, Unilever makes its money through a variety of revenue streams. Its sales are quite evenly distributed among its business arms, although its Ice Cream unit is a little smaller than the other four. The company makes money by manufacturing and selling its branded products to consumers. Indeed, the firm’s most popular brands are the lifeblood of the business, accounting for 55% of its turnover.
On the geographical front, the group operates all around the world, but receives more of its revenue from emerging markets, and more specifically from Asia, Pacific, and Africa regions. However, Unilever operates in the Americas and Europe as well.
With a diversified product range, Unilever’s central aim is to build a high-growth portfolio across each segment of the group. In delivering this, Unilever relies on its extensive manufacturing facilities comprising 280 factories to process more than 25m customer orders annually. Moreover, the conglomerate invests heavily in its marketing operations to protect and develop the quality of its brands.
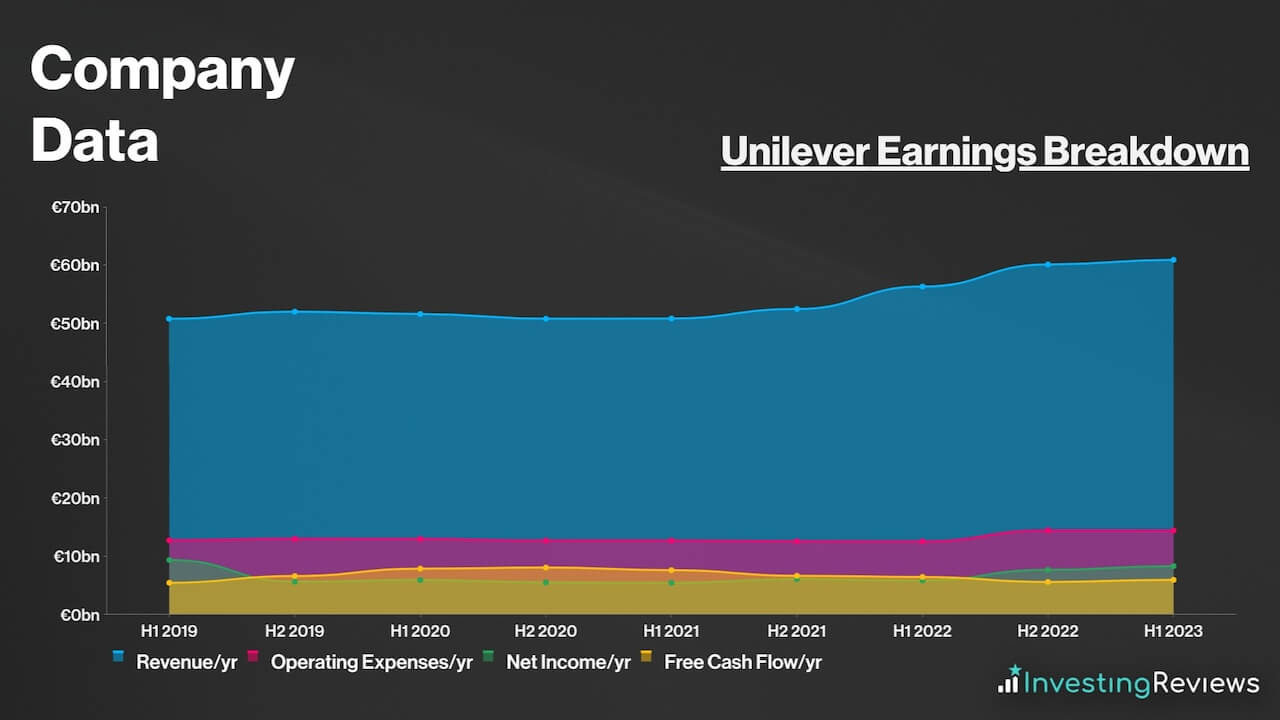
Unilever Earnings Breakdown
Unilever operates a retail/fast-moving consumer goods (FMCG) business model for the most part, and earns its profits from manufacturing products, and then selling them to customers via retailers and wholesalers to turn a profit.
Because most of Unilever’s profits stem from wholesaling, profit margins are considered to be better than direct retailing. That’s because the business sells directly to the retailer in most instances, cutting out the middleman.
Unilever Financials
On the face of it, Unilever’s balance sheet may be off-putting to some as its current liabilities trump its current assets by €5.25bn. Nonetheless, this is considered to be a norm in the FMCG industry, especially for giant manufacturers.
This is due to a neat trick where manufacturers use credit (debt) to purchase commodities from suppliers, which can be repaid within one year from its strong working capital. This is categorised as “Trade Payables and Other Current Liabilities” on its balance sheet.
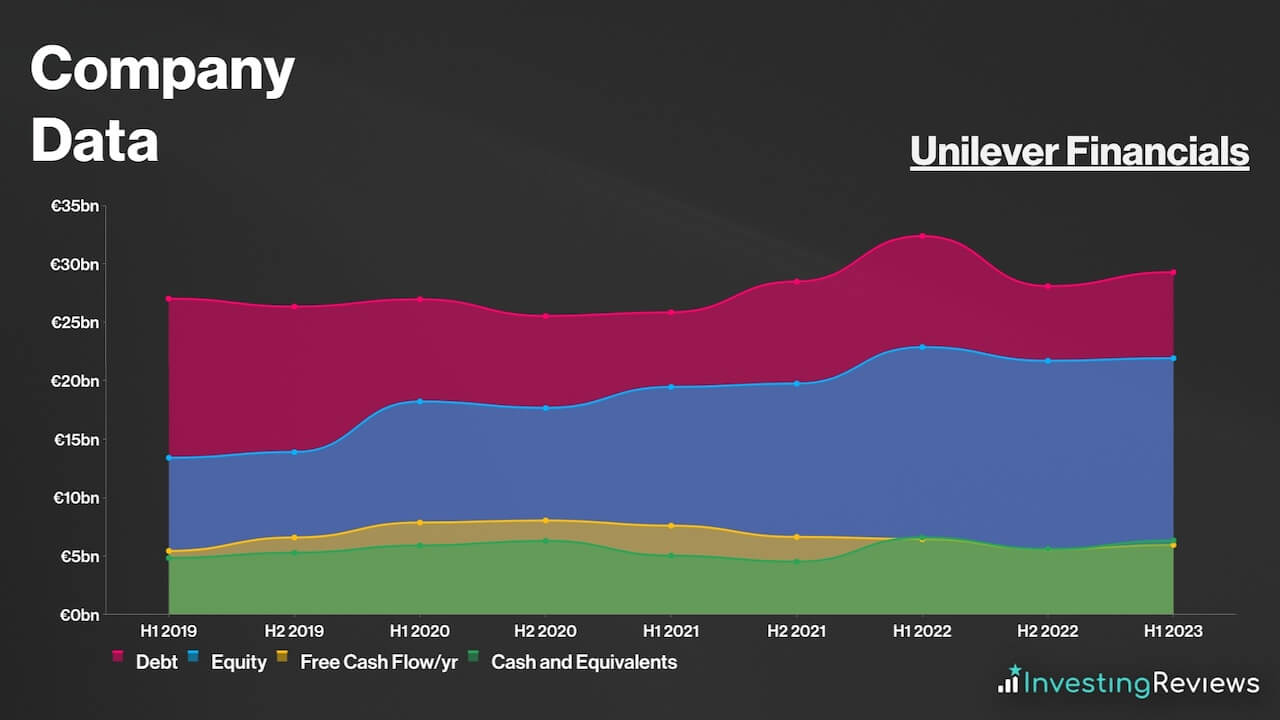
Therefore, it wouldn’t be unreasonable to discount this amount (€17.37bn) from Unilever’s current liabilities as they’re more than likely to meet these obligations given their large customer base. Thus, excluding Unilever’s “Trade and Other Payables”, its current liabilities shrink from €25.61bn to €8.24bn, and can be easily covered by its current assets worth €20.36bn.
Upon taking this figure out, Unilever’s balance sheet looks a little healthier, with a debt-to-equity ratio of 134%. Even so, this is comparably worse than many other FTSE constituents who have much lower debt levels, as there still remains a debt pile worth €29.28, which the FMCG giant’s liquidity and free cash flow can’t sufficiently cover all at once.
Either way, its debt maturity profile isn’t alarming, with repayments spread out rather evenly over the course of the next decade or so.
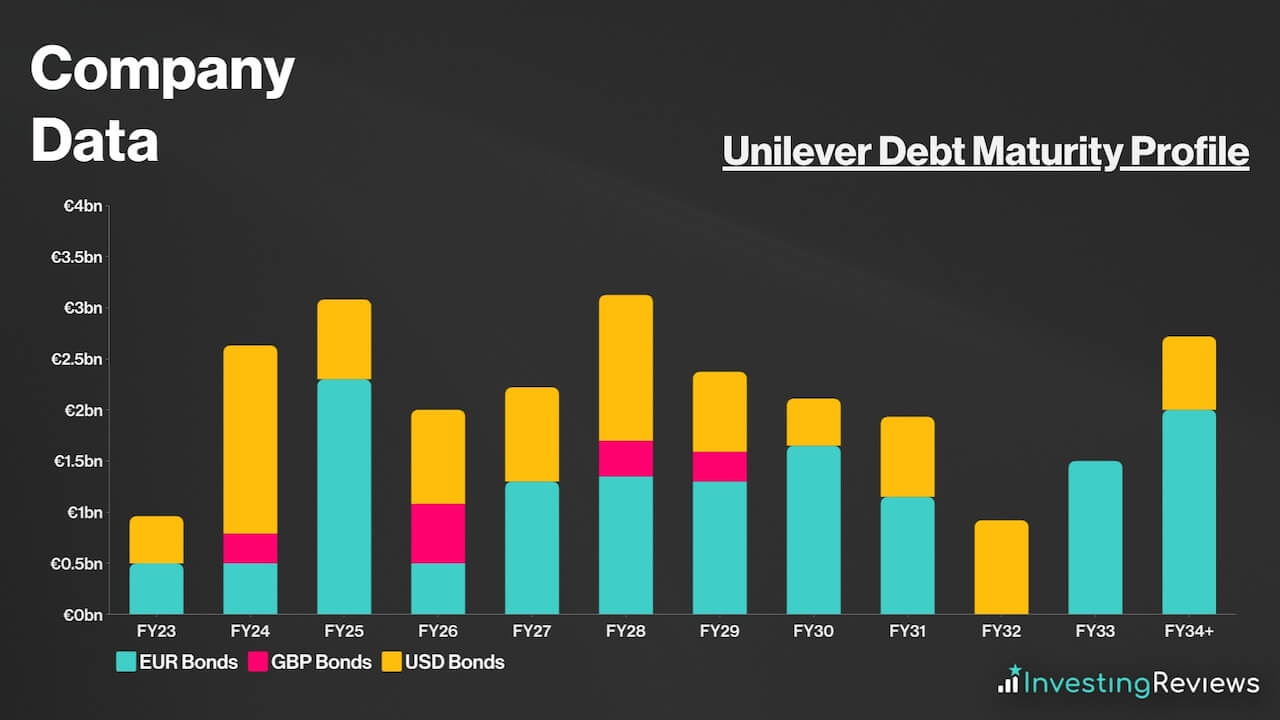
With less than €4bn due per year, over the next decade, Unilever should have sufficient liquidity to pay off its debt in the coming years, as long as it continues to generate cash at these levels. It’s also worth noting that Unilever has $5.2bn and €2.6bn worth of undrawn committed facilities. This means that it has the option to inject more liquidity into the business if it needs to.
Overall, Unilever currently has a net debt to EBITDA ratio of 3.3x, which is above the standard ratio of 3.0x for companies. That being said, its fixed charge cover sits at a strong 3.3x. For those reasons, it’s safe to say that its debt pile is manageable, as the board continues to efficiently utilise capital and generate further value for shareholders.
Unilever Competitive Advantage
Having an economic moat (competitive advantage) over competitors is crucial in saturated industries such as consumer goods, where profit margins aren’t the highest, with low barriers to entry.
As such, Unilever’s main competitive advantage is its dominant market share, as brand loyalty is a crucial asset during inflationary times when rising costs eat into profit margins. Unilever has managed to rely on its strength here in passing on price hikes to consumers across its various divisions. In turn, this has underpinned strong sales growth for the group as a whole.
Unilever recognises the importance of intellectual property to its business. A recent €0.4bn boost in its marketing investment and a strategy to prioritise its highest-value brands should assist the corporation in its efforts to grow market share. Currently, a total of 14 Unilever brands are valued in excess of €1bn.
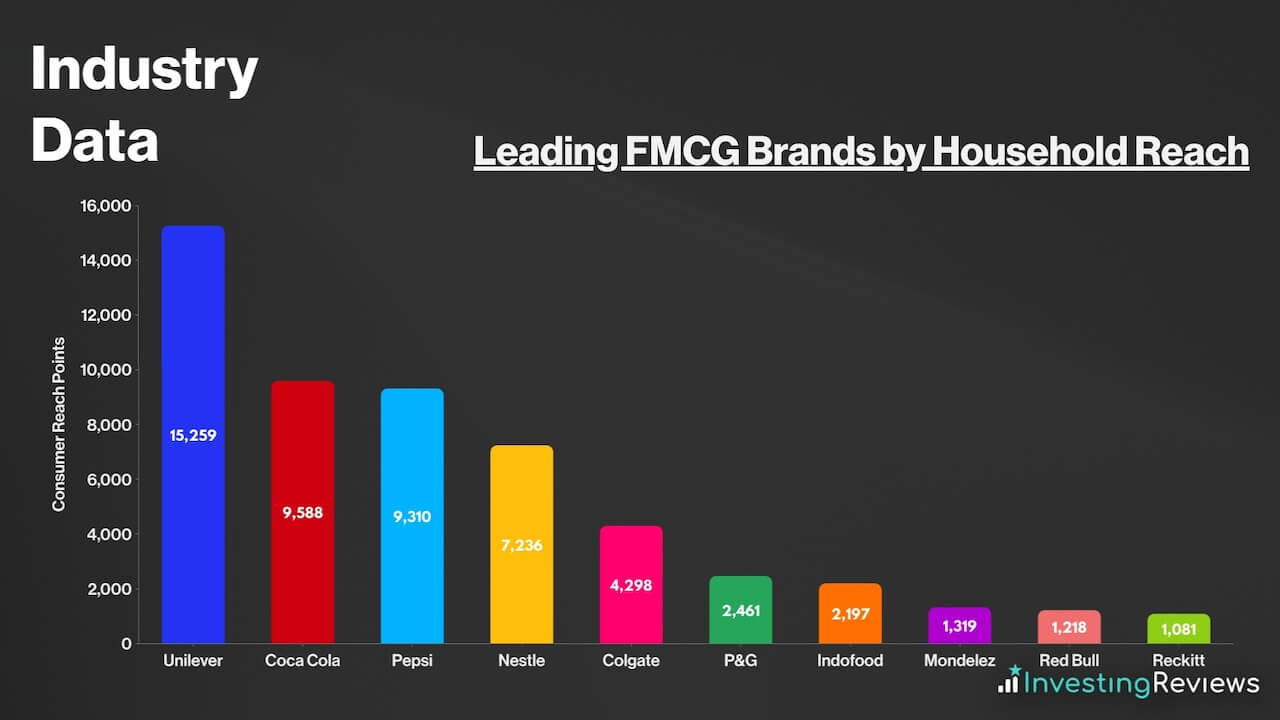
Diversification is another string to Unilever’s bow. The Dove owner has a broad range of business interests across different sectors, from being the world’s largest manufacturer of soap to the maker of Marmite. In addition, Unilever has highly geographically diversified sources of revenue due to its presence in almost every corner of the globe. An estimated 3.4bn consumers use its products every day worldwide.
Unilever’s sheer size allows it to benefit from economies of scale and remain competitive across its key markets, all while being able to increase investments in capital expenditure and R&D. Preserving a competitive advantage is never guaranteed for any company. Having said that, a credible strategy to support and develop its brand portfolio with investment levels to match bodes well for the future.
Unilever Shortcomings
Despite being such a giant in the FMCG space, Unilever also has its fair share of weaknesses. This could put investors off when buying Unilever shares.
For one, its profit margins can be subject to volatility, ranging from 11% to 18% in a good year. This means that a black swan event like an inflationary shock, for example, could plunge Unilever’s profitability. And in the current cost-of-living crisis, net profits have declined to just 11%, showing how delicate its margins are.
Another cause for concern is the falling percentage of Unilever’s businesses winning market share. Part of the reason behind this is the consortium’s drive to streamline its operations, resulting in a 17% reduction in stock-keeping units (SKUs). Unilever’s current priority hinges on growing its high-value brands, but this shouldn’t come at the expense of growth in the remaining 45% of the portfolio.
Finally, falling sales volumes in Europe and across multiple divisions of the business add credence to the argument that Unilever is reaching the threshold of its pricing power, especially when inflation continues to tap into consumers’ wallets. These figures will no doubt have caught CEO Hein Schumacher’s eye as he strives to steer the company towards a more profitable and streamlined future.
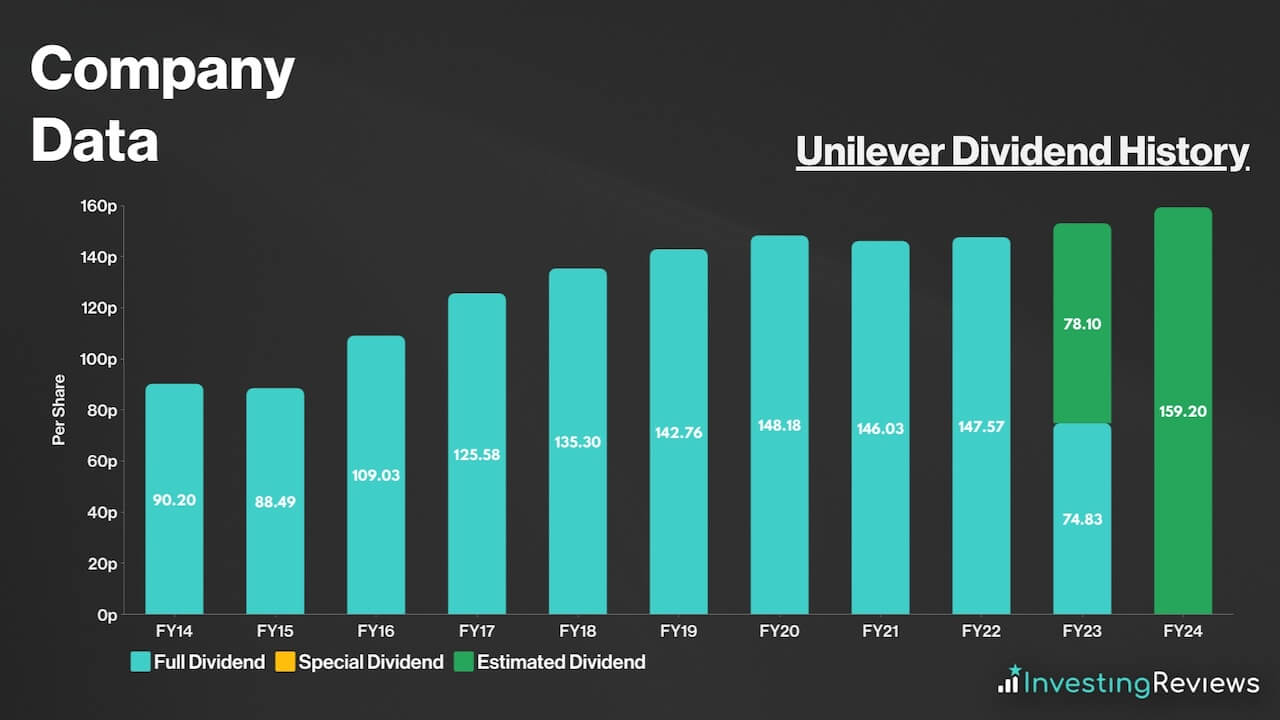
Unilever pays a dividend and has been paying dividends for almost a century; even through financial crises. This makes Unilever a dividend aristocrat given its impressive track record of shareholder payments.
For that reason, Unilever shares are known for their ‘safety’, and are a favourite among dividend investors seeking passive income. The stock has become even more popular amongst investors over the past few years due to its incredible resilience to recent inflationary headwinds. In addition to that, its dividends are well covered at 1.7x.
Unilever is expecting to continue paying a dividend for the foreseeable future. Currently, analysts are forecasting dividends to rise over the next two years.
Unilever shares are currently trading at a discount when compared to their industry competitors. Their adjusted P/E ratio is very much in line with the index average too. What’s more, their P/S ratio sits comfortably around 1, which could indicate tremendous growth potential from its sales.
[stock_market_widget type=”table-quotes” template=”basic” assets=”ULVR.L,RKT.L,PG,MDLZ,EL” fields=”name,price_book,price_to_sales_trailing_12_months,pe_ratio,forward_pe_ratio” links=”{‘ULVR.L’:{},’RKT.L’:{},’PG’:{},’MDLZ’:{},’EL’:{}}” display_header=”true” display_chart=”false” display_currency_symbol=”false” pagination=”false” search=”false” rows_per_page=”5″ sort_field=”logo_name_symbol” sort_direction=”asc” alignment=”left” api=”yf” ]
Among the 20 qualified analysts covering Unilever shares, the consensus is for Unilever to grow its top and bottom lines over the next two years, as it recovers from high costs during the cost-of-living crisis with a return to higher discretionary spending.
| Metrics | FY22 (Reported) | FY23 | FY24 |
|---|---|---|---|
| Turnover | €60.07bn | €60.10bn | €62.07bn |
| Underlying Diluted EPS | €2.57 | €2.62 | €2.79 |
Data source: Unilever, Financial Times
Unilever shares currently have an average Hold rating from several brokers. But with an average price target of 4295p, brokers seem to agree that there’s upside potential for Unilever shares over the next 12 months.
| Date | Brokerage | Rating | Price Target |
|---|---|---|---|
| 13/10/2023 | Bryan Garnier & Co. | Hold | 4665p |
| 11/10/2023 | RBC | Hold | 4300p |
| 5/10/2023 | JPMorgan | Sell | 3900p |
| 26/9/2023 | Berenberg | Buy | 5160p |
| 6/9/2023 | Bernstein | Sell | 3800p |
| 26/7/2023 | Barclays | Hold | 4300p |
| 26/7/2023 | Deutsche | Buy | 4600p |
| 26/7/2023 | Credit Suisse | Buy | 5000p |
| 26/7/2023 | UBS | Sell | 3190p |
| 9/5/2023 | Jefferies | Buy | 5000p |
| 3/5/2023 | Goldman Sachs | Hold | 4600p |
| 21/2/2023 | DZ Bank | Hold | 4550p |
| 15/2/2023 | Bryan Garnier | Hold | N/A |
Data source: Market Screener
My price target for Unilever shares was last updated on 13th October 2023.
| Metrics | Adjusted FY23 (Projected) | Comments | |
|---|---|---|---|
| Beauty & Wellbeing | €12.86bn | c.5% growth — improving volumes and price growth paired with inelastic demand. | |
| Personal Care | €14.32bn | c.5% growth — improving volumes and price growth paired with inelastic demand. | |
| Home Care | €12.40bn | Flat growth — strong price growth offset by small decline in volumes. | |
| Nutrition | €13.10bn | Flat growth — strong price growth offset by small decline in volumes. | |
| Ice Cream | €6.52bn | c.5% decline — strong price growth offset by moderate decline in volumes. | |
| Turnover | €59.20bn | ||
| Operating Expenses | €48.90bn | c.82.6% of turnover — higher than FY22 due to increased marketing investments, but offset somewhat by €600m cost-saving programme. | |
| Operating Profit | €10.30bn | ||
| Pensions and Similar Obligations | €0.10bn | ||
| Finance Income | €0.40bn | Higher interest receivables from higher interest rates. | |
| Finance Costs | €1.20bn | Higher than FY22 due to rising rates of bonds and commercial papers. | |
| Income from JVs | €0.20bn | ||
| Net Gains from Hyperinflationary Economies | -€0.15bn | ||
| Other Income from Non-Current Investments | -€0.02bn | ||
| Profit Before Tax | €9.63bn | ||
| Taxation | €2.41bn | Underlying effective Tax Rate of c.25%, in line with guidance. | |
| Non-Controlling Interests | €0.65bn | c.1.1% of turnover — in line with recent average. | |
| Profit for FY23 | €6.57bn | ||
| Shares in Issue | 2.53bn | Remaining buyback of €750m of €3bn share buyback programme for FY23. | |
| Underlying Diluted EPS | €2.57/224p | ||
| Price Target | 4218p (BUY) | ||
Looking ahead, Unilever looks well placed to benefit from an improving macro outlook as inflation falls in many countries across the world. Thus far, the consumer goods titan has successfully relied on strong consumer loyalty toward its high-value brands to navigate recent inflationary shocks. Delivering revenue growth across all divisions, from beauty to ice cream, in a cost-of-living crisis is no mean feat.
A reliable dividend history, strong defensive credentials, and a decent yield all add to Unilever’s investment appeal. That said, returns over the past five years have been pedestrian. If inflation fails to fall as fast as expected, long-term Unilever shareholders could continue to suffer as the company’s margins come under further pressure.
Still, Unilever’s portfolio consists of many instantly recognisable brands and remains the jewel in the company’s crown. Continued investment in marketing and R&D suggests the board has a credible strategy to preserve the group’s competitive advantage. Ultimately, this should continue to support revenue and dividend growth, which gives me sufficient room to give the stock a Buy rating as a defensive addition for reliable passive income.
Charlie Carman, Equity Research Analyst
Please note: Charlie Carman has no positions in Unilever. These stock analysis reports are not personal recommendations or advice and should never be treated as such.
The value of your investments (and any income from them) can go down as well as up and you may not get back the full amount you invested. Past performance is not a reliable indicator of future performance. Investments should be considered over the longer term and should fit in with your overall attitude to risk and financial circumstances.
- Learn how to invest in the FTSE100
- Have you considered transferring your pension?
- Find the best trading platforms