

My Lloyds share price forecast includes a 360-degree examination to determine whether investors should bank on this stock to perform.
This stock analysis report goes into detail on Lloyds’ financial position, competitive strengths, industry outlook, valuation metrics, and analysts’ predictions to uncover whether Lloyds shares actually present a golden long-term opportunity.
Read On: To find the Lloyds share price forecast and my price target.
- Lloyds Share Price (LON:LLOY)
- Lloyds Background
- Lloyds Business Model
- Lloyds Earnings Breakdown
- Lloyds Financials
- Lloyds Competitive Advantage
- Lloyds Shortcomings
- What is the Dividend Forecast for Lloyds Shares?
- Are Lloyds Shares Cheap?
- What is the Profit Forecast for Lloyds Shares?
- What is the Lloyds Share Price Forecast?
- What is the Price Target for Lloyds Shares?
- Are Lloyds Shares a Buy, Sell, or Hold?
[stock_market_widget type=”card” template=”basic2″ assets=”LLOY.L” display_currency_symbol=”false” style=”font-size: 1.0rem” api=”yf”]
Lloyds Background
Lloyds is a British banking institution, and is the UK’s biggest commercial bank by number of customers. The company doesn’t have an investment banking arm, but it has a huge presence in retail banking, and is the country’s largest mortgage provider.
It operates a number of subsidiaries that include Lloyds itself, Halifax, Bank of Scotland, Scottish Widows, and many more. The group offer a wide range of financial products and services such as financial services, personal banking, mortgages, loans, insurance, and investment products.
Lloyds shares trade on the London Stock Exchange and are constituents of the FTSE 100.
Find Out: How easy it is to buy Lloyds shares in 6 simple steps.
Lloyds Business Model
As a bank, Lloyds makes its money through different means as compared to a traditional business. It operates based on leverage — where a company uses borrowed money/debt to purchase assets in order to generate income and sell them later on for a profit.
In this instance, Lloyds uses investors’ and customers’ funds to issue loans. It then generates income from the interest it charges on those loans. A portion of those profits are then paid into customers’ savings accounts as interest. The difference between what it earns from loans and what it pays in interest is its profits. This is otherwise known as net interest income.
Lloyds earns the bulk of its income from its retail customers. As the nation’s biggest mortgage provider, it’s no surprise that the institution earns most of its profits from mortgage loans and other personal-related loans. It also boasts other products and services such as credit cards, personal loans, motor finance, and savings accounts.
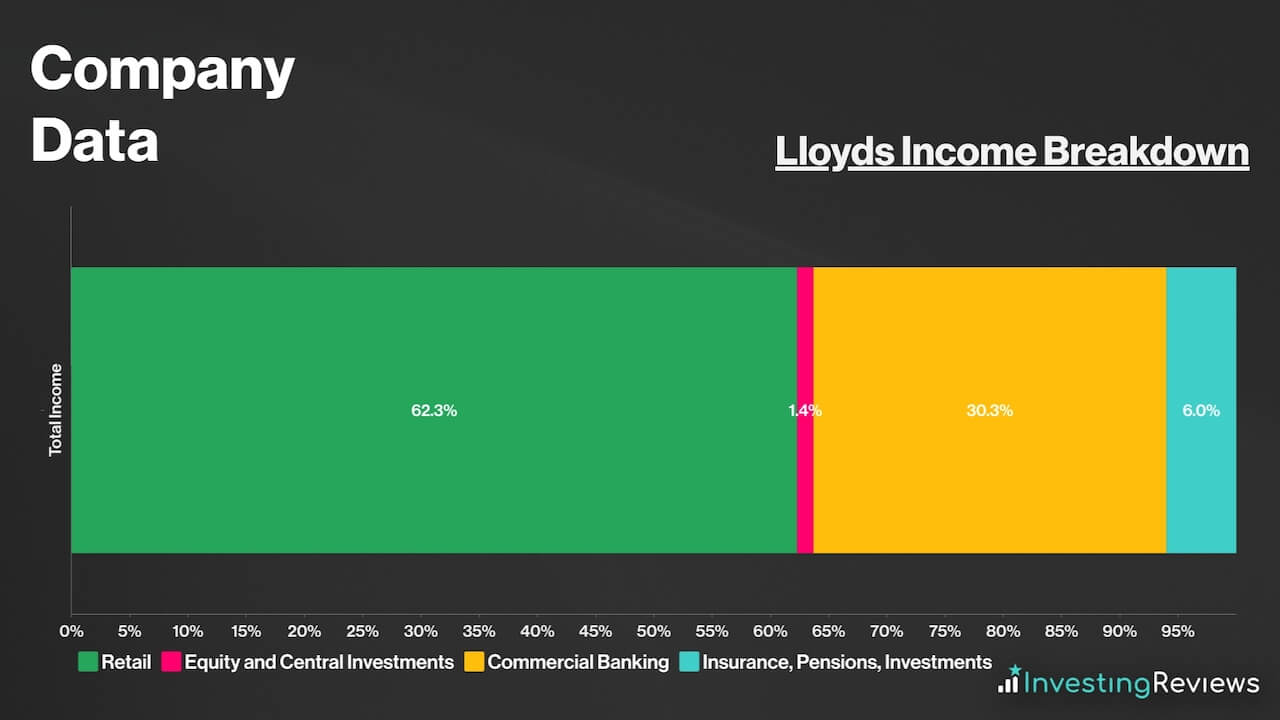
Further, Lloyds earns income from commercial customers too, where it offers business loans, wealth management services, debt capital, and more.
Apart from that, the Black Horse bank also earns income from insurance, pensions, and other investments. Unlike its other segments, the income in this segment is earned through fees (advisory services, management fees, investment income, etc.). This is classified as “Other Income” in Lloyds’ income statement.
Lloyds Earnings Breakdown
Lloyds is a profitable business, and has been since the great financial crisis in 2008. The lender has been generating healthy profit margins which have been growing over the past few years.
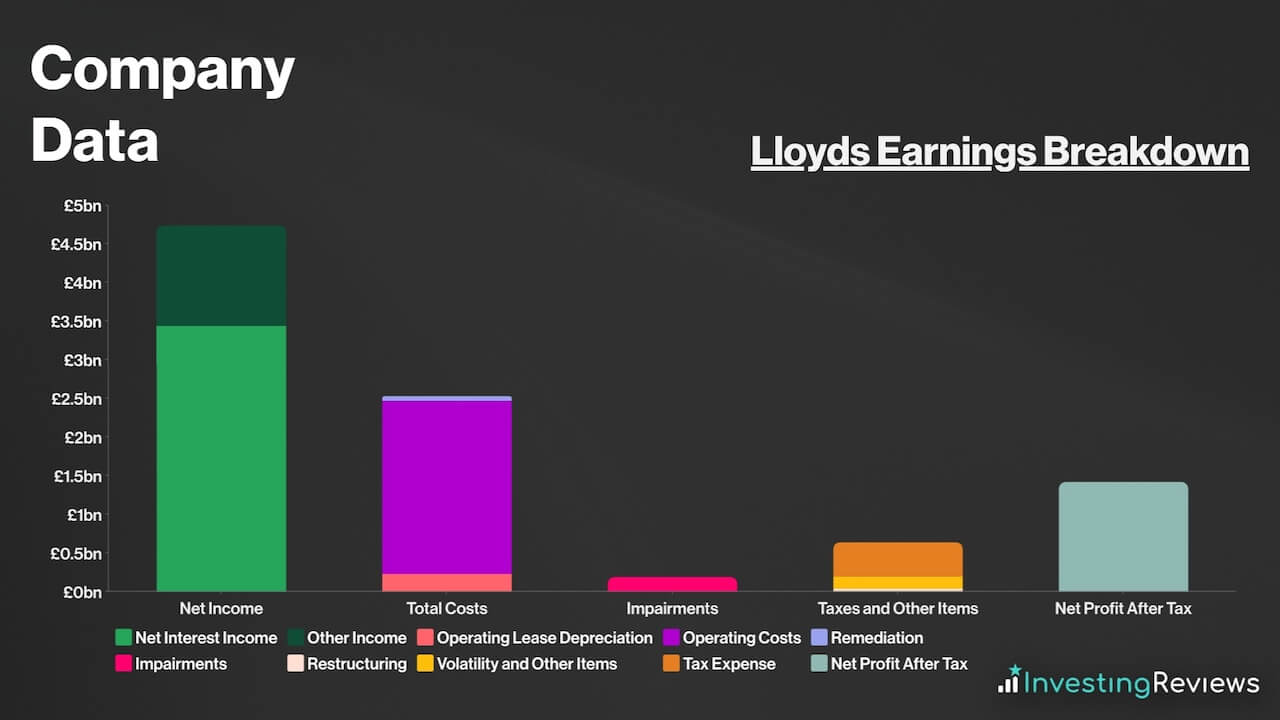
Even so, Lloyds’ profits aren’t as high as some of its investment banking peers due to its lack of exposure to that part of the market. As such, its income and profits are extremely sensitive to interest rates. Considering that interest rates were at near zero over the last decade and a half, high profits for the FTSE 100 stalwart were hard to come by until recently.
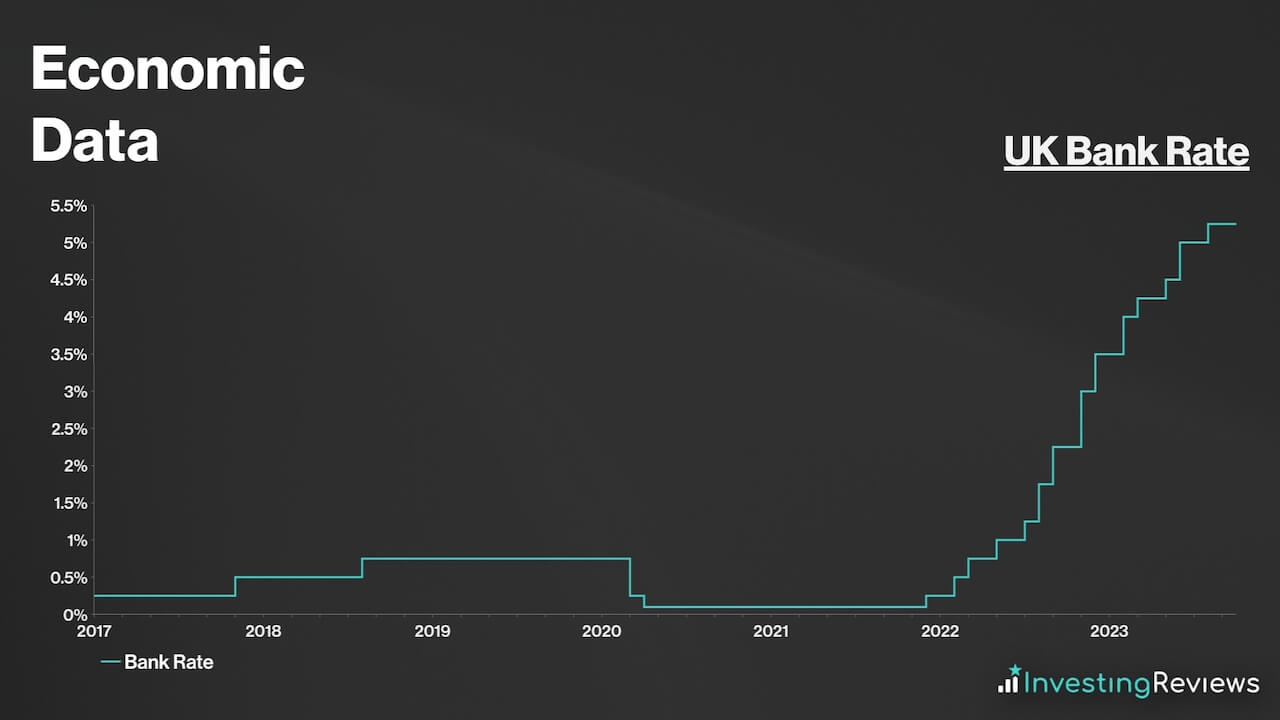
Nonetheless, the rapid rise of inflation in 2022, due to a combination of excess money supply from the pandemic, supply chain issues, and Russia’s invasion of Ukraine, has forced the Bank of England to raise interest rates at a fleeting pace to combat sky-high prices.
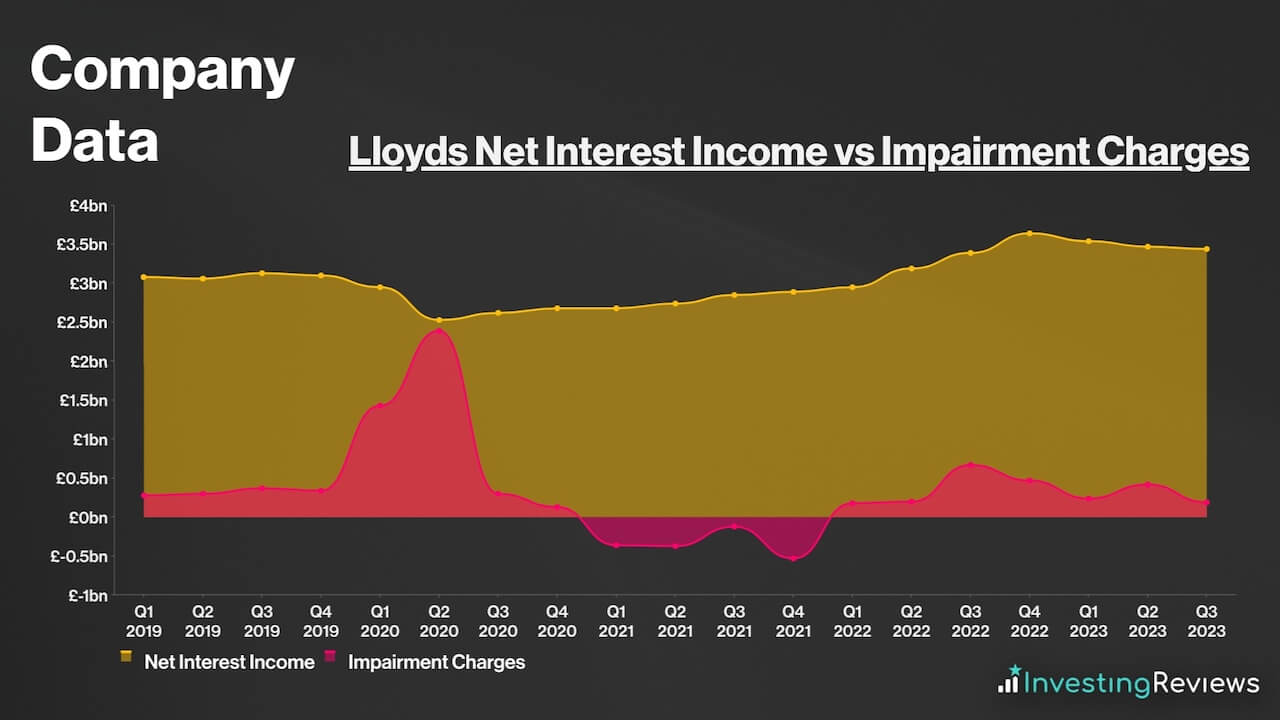
As a result, Lloyds has been one of the main beneficiaries of this move. That’s because higher interest rates mean Lloyds can charge higher interest rates on the loans it makes, while benefitting from the interest it earns from storing customer deposits with the central bank. This has allowed it to expand its net interest margin.
Having said that, it’s worth cautioning that higher rates can also trigger higher impairments, as more customers default on their loans from having to pay higher interest. As a consequence, impairments tend to rise and offset higher profits. Lloyds will be hoping that the bank rate eventually consolidates at a level that many refer to as the ‘goldilocks zone’, where it can make high profits while seeing low defaults.
Lloyds Financials
On the face of it, Lloyds’ financials don’t look the best due to its high debt-to-equity ratio. In spite of that, it’s worth noting that this is because Lloyds is a high-leverage business.
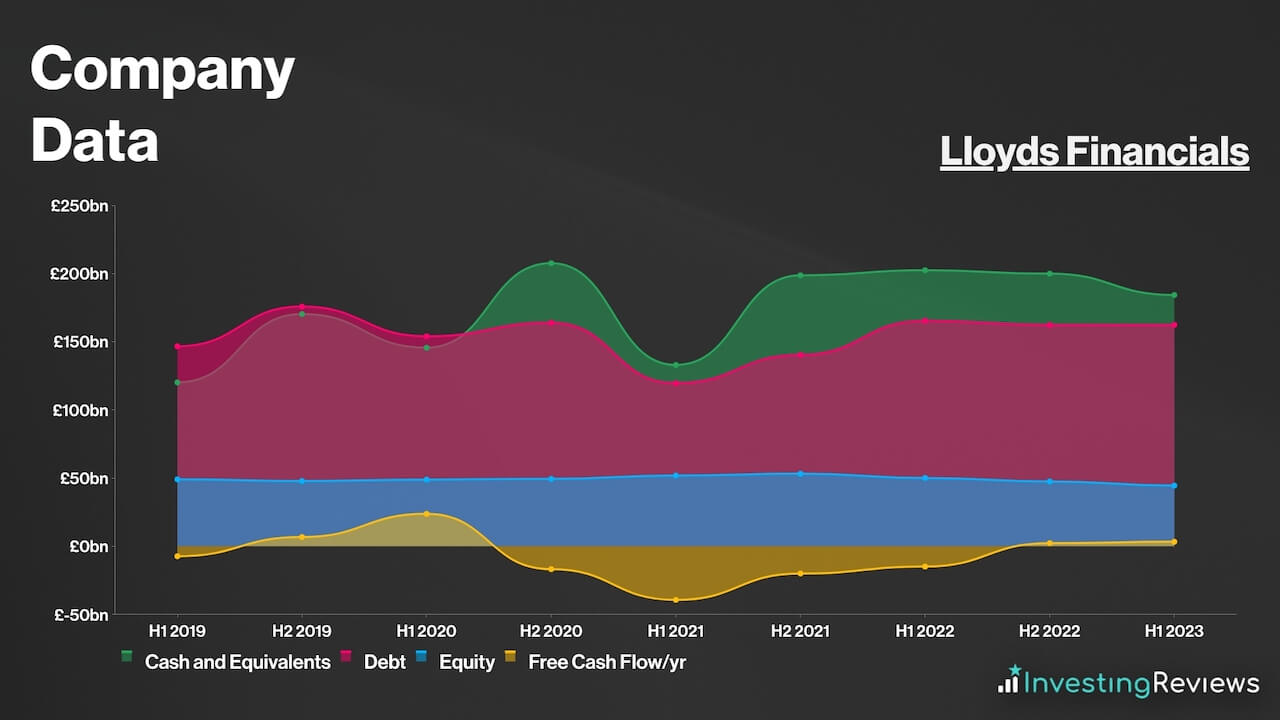
Thus, other metrics might better indicate the bank’s health:
- Asset Quality Ratio: The quality of a bank’s loan portfolio. It measures the ratio of non-performing loans (NPLs) to total loans.
- CET1 (Common Equity Tier 1) Ratio: The amount of highest-quality capital a bank holds to support its risk-weighted assets. It’s a key measure of a company’s underlying financial strength.
- Liquidity Coverage Ratio: The amount of highly liquid assets (eg. cash) to meet short-term obligations (eg. withdrawals).
- Return on Tangible Equity (RoTE): The measure of a company’s profitability in relation to its tangible equity. It’s one of the better-known metrics to measure a bank’s profitability. Banks tend to target a RoTE between 10% to 15%.
| Metrics | Lloyds | Industry Average |
|---|---|---|
| Asset Quality Ratio | 0.17 | 0.19 |
| CET1 Ratio | 14.6% | 14.3% |
| Liquidity Coverage Ratio | 142% | 147% |
| RoTE | 16.9% | 16.2% |
Data source: Lloyds
So, based on the indicators above, it’s safe to say that Lloyds as a bank, is in a pretty healthy position. Its average asset quality ratio is well buffered by its mighty CET1 ratio. And although its liquidity coverage ratio is a tad bit lower than the industry average, it’s good to see that at least it’s being put to good use given its high RoTE.
Lloyds Competitive Advantage
Having an economic moat (competitive advantage) over competitors is crucial in saturated industries such as banking, where profit margins can be volatile, depending on the interest rate environment.
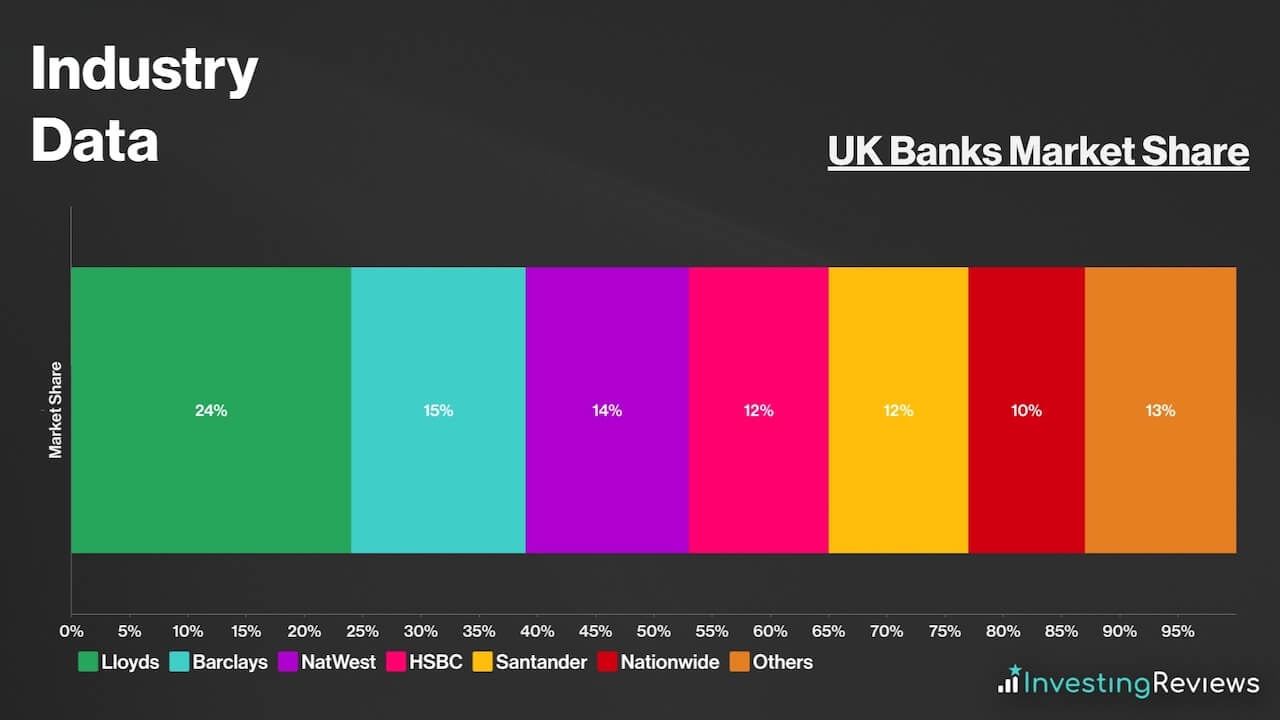
As such, Lloyds’ main competitive advantage would be its size. As the UK’s largest bank and mortgage provider, it holds the largest market share, and is renowned as a mainstay of the banking industry. As a result of this, Lloyds has the widest economic moat any company desires — a ‘too big to fail’ status. This is due to its ties with the rest of the economy, as a bank failure of this size could be catastrophic for the entire nation.
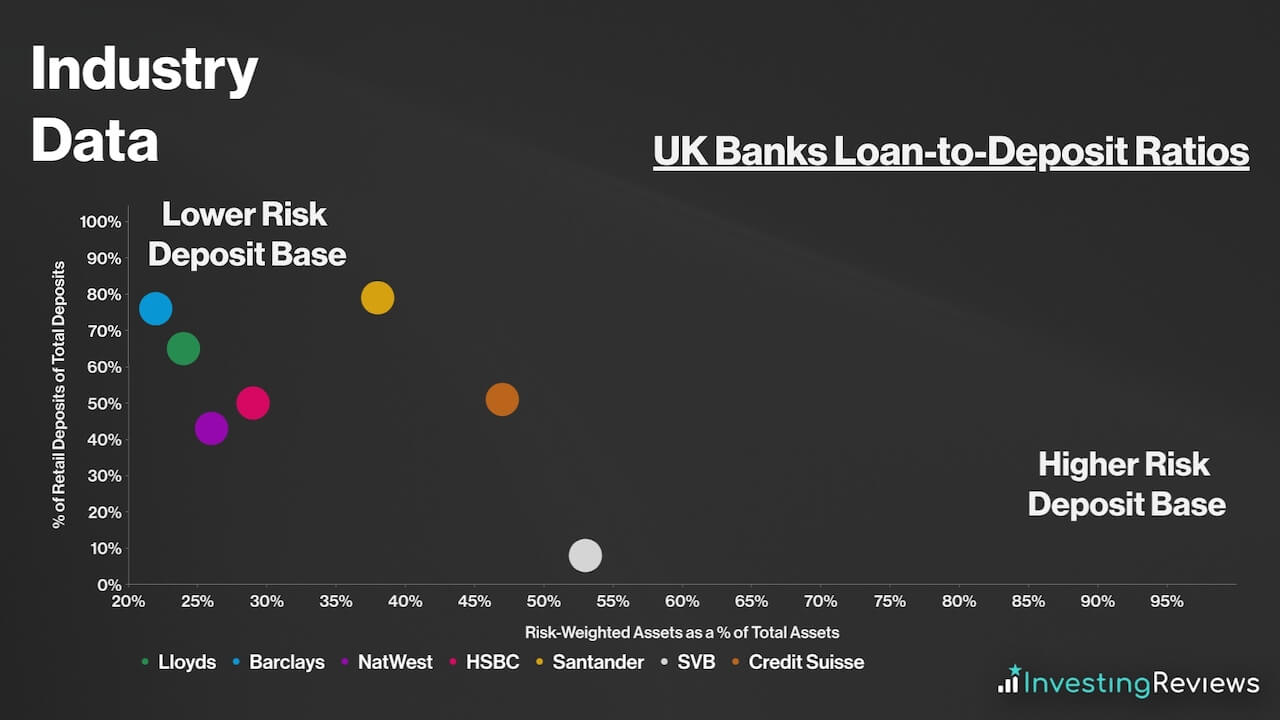
Aside from that, Lloyds has also got an extremely robust capital base as evidenced by its high CET1 ratio, countercyclical capital buffers, and lower-risk deposit base. This has allowed it to be more immune to the banking crisis which was sparked by the collapse of several regional banks in the US.
In addition to that, one of Lloyds’ subsidiaries, Citra has partnered with the UK’s largest housebuilder, Barratt to build and rent up to 50,000 homes over the next decade to address the massive disparity between house supply and rental demand. Bearing in mind, rental prices have sky-rocketed and present a lucrative opportunity for Lloyds.
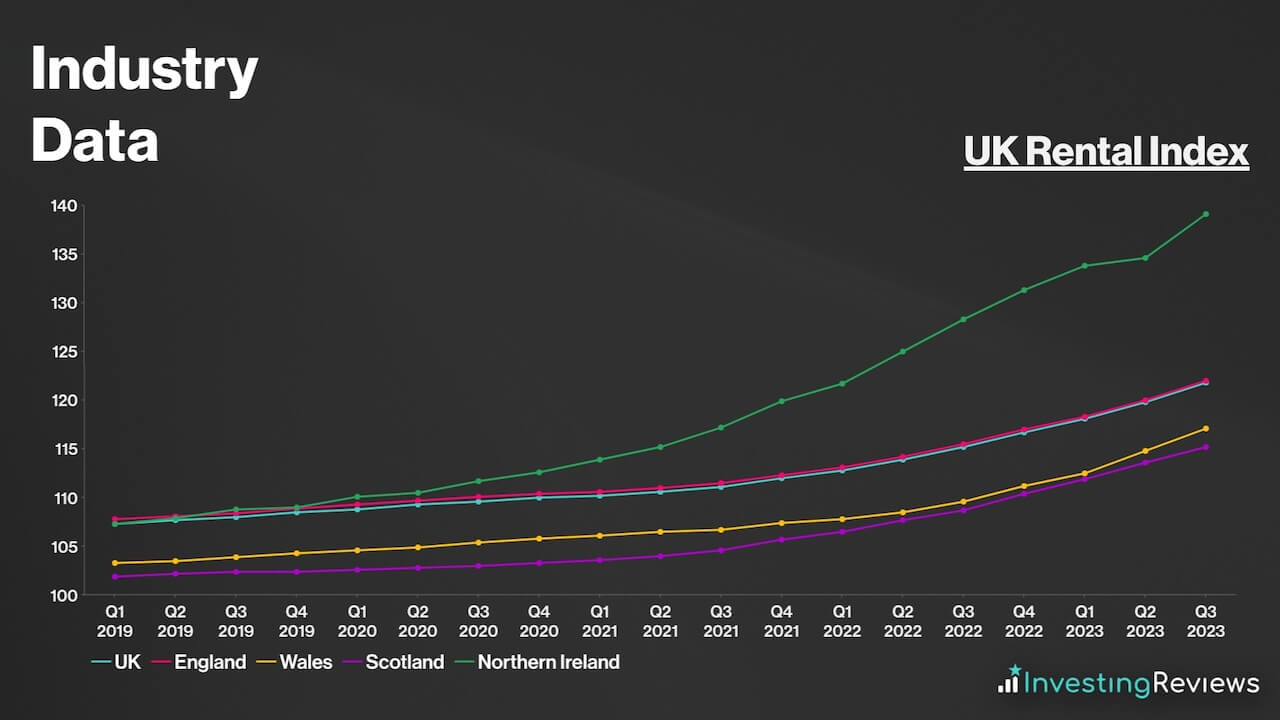
Given that housing supply continues to pull further away from demand, property prices are only going to go up over the long term. Therefore, Lloyds has got a tremendous opportunity as the UK’s largest mortgage lender. Net interest income has the potential to continue growing for the foreseeable future with the bank rate not anticipated to drop back to sub-zero levels for a little while longer.
Lloyds Shortcomings
Despite being such a giant in the banking space, Lloyds also has its fair share of weaknesses. This could put investors off when buying Lloyds shares.
For one, Lloyds’ main weakness would be its balance sheet. There’s no doubt that its financials are stellar, but only as a bank. On paper, banks have one of the worst balance sheets due to their leverage-heavy operating model. This means that they’re susceptible to credit crunches and liquidity crises (bank runs). The collapse of several regional banks in the US only goes to show how fragile these institutions can be.
Moreover, Lloyds has to deal with much stricter regulations in the UK as compared to the US. The Bank of England requires banks in the UK to operate with higher capital buffers. This is seen as a strength in the eyes of customers given the added security it brings. However, it also limits a bank’s earnings potential.
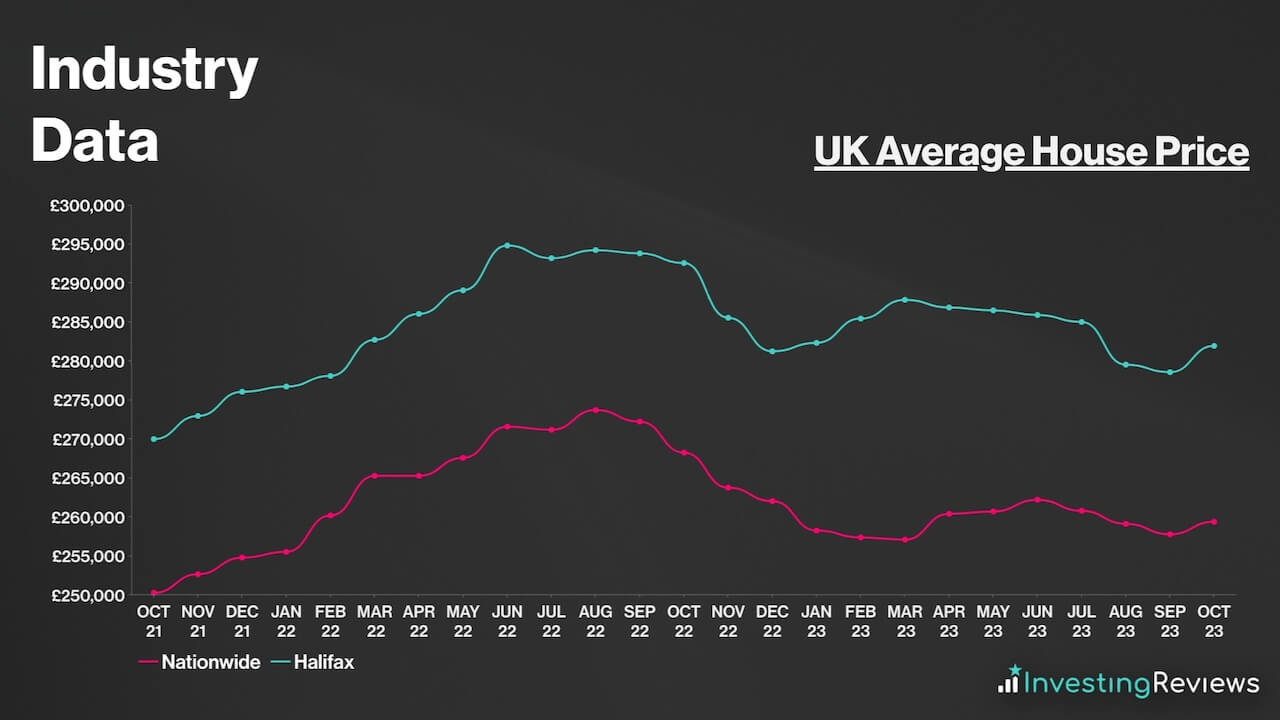
Further exacerbating the issue, stubbornly high inflation may cause the Bank of England to continue with its rate hikes. This will also force Lloyds to set more provisions aside to cover for potential bad debt. This pushes mortgage affordability down, resulting in slower loan growth, and has seen house prices decline over the past year — not a positive for Lloyds’ top line.
Furthermore, Lloyds has to combat higher savings rates being offered by other banks and money market funds, as large disparities between savings rates could see deposit outflows heighten. And when considering Lloyds’ lack of geographical and industrial diversity, its fate is at the mercy of the British economy.
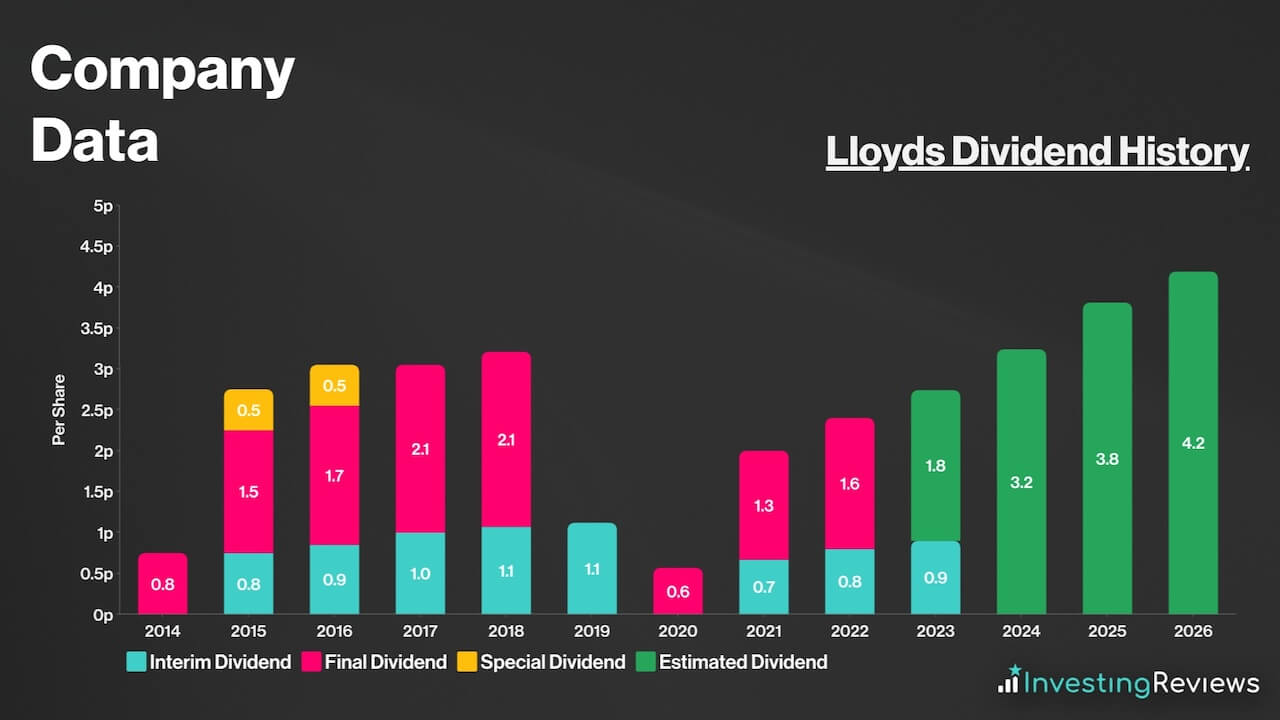
Lloyds pays a dividend and has been paying dividends since 2014, after it was obliged to withhold payments between 2008 and 2013 due to the great financial crisis.
Be that as it may, Lloyds shares are still a favourite among dividend investors seeking passive income. This is due to the stock’s growing payouts over the years along with the organisation’s commitment to having a progressive dividend. The board also considers paying a special dividend every year end to return any surplus capital, which is a huge plus for long-term investors. More importantly, its dividends are well covered at 3.0x.
Lloyds is expecting to continue paying a dividend for the foreseeable future. Currently, analysts are forecasting dividends to grow, with the dividend rising healthily over the next four years.
Lloyds shares are currently trading at a massive discount when compared to their industry competitors and the FTSE 100 on an adjusted basis. What’s more, their P/B ratio sits comfortably below 1, which indicates that the stock is trading way below its book value.
[stock_market_widget type=”table-quotes” template=”basic” assets=”LLOY.L,BNC.L,BARC.L,HSBA.L,NWG.L” fields=”name,price_book,price_to_sales_trailing_12_months,pe_ratio,forward_pe_ratio” links=”{‘LLOY.L’:{},’BARC.L’:{},’HSBA.L’:{},’BNC.L’:{},’NWG.L’:{}}” display_header=”true” display_chart=”false” display_currency_symbol=”false” pagination=”false” search=”false” rows_per_page=”5″ sort_field=”logo_name_symbol” sort_direction=”asc” alignment=”left” api=”yf” ]
Among the 18 qualified analysts covering Lloyds shares, the consensus is for Lloyds to grow its top and bottom lines over the next two years, with higher net interest income being the main catalyst for this.
| Metrics | FY22 (Reported) | FY23 | FY24 |
|---|---|---|---|
| Net Interest Income | £13.17bn | £13.92bn | £13.74bn |
| Net Income | £17.75bn | £18.27bn | £18.27bn |
| Impairments | £1.51bn | £1.39bn | £1.51bn |
| Basic EPS | 7.3p | 7.4p | 7.5p |
| Return on Tangible Equity (RoTE) | 13.5% | 14.9% | 14.3% |
Data source: Lloyds
Lloyds shares currently have an average Buy rating from several brokers. With an average price target of 58p, brokers seem to agree that there’s upside potential for Lloyds shares in the next 12 months.
| Date | Brokerage | Rating | Price Target |
|---|---|---|---|
| 26/10/2023 | JPMorgan | Sell | 41p |
| 26/10/2023 | Barclays | Buy | 67p |
| 16/10/2023 | Citi | Buy | N/A |
| 10/10/2023 | Jefferies | Buy | 80p |
| 22/9/2023 | Deutsche | Buy | 62p |
| 27/7/2023 | Goldman Sachs | Buy | 80p |
| 27/7/2023 | RBC | Buy | 68p |
| 21/6/2023 | BNP Paribas | Hold | 52p |
| 4/5/2023 | Credit Suisse | Buy | 69p |
| 3/5/2023 | Berenberg | Hold | 58p |
| 3/5/2023 | Shore Capital | Buy | N/A |
| 11/1/2023 | Morgan Stanley | Hold | 60p |
Data source: Market Screener
My price target for Lloyds shares was last updated on 26th October 2023.
| Metrics | Statutory FY23 (Projected) | Comments | |
|---|---|---|---|
| Total Deposits | £472.92bn | c.-0.5% — Deposit outflows to more attractive money market funds and savers accounts at other banks. | |
| Average Interest-Earning Banking Assets | £453.06bn | c.95.8% of total deposits — Higher assets in H2 to offset lower H1 average. | |
| Underlying Net Interest Income | £14.14bn | c.3.12% net interest margin — structural hedges to offset higher shift towards less liquid and higher savings rate accounts. | |
| Underlying Other Income | £5.13bn | c.10% growth — improved offerings across business divisions. | |
| Operating Lease Depreciation | £0.90bn | Higher depreciation of higher-value vehicles from Tusker acquisition, lower gains on disposals, and recent declines in used EV prices. | |
| Net Income | £18.37bn | ||
| Operating Costs | £9.05bn | Slightly lower than guidance of c.£9.10bn given recent trends. | |
| Remediation | £0.25bn | In line with long-term guidance of £200m to £300m a year. | |
| Impairments | £1.15bn | Lower than consensus due to Lloyds’ more affluent customer base and bank rate peaking. | |
| Restructuring, Volatility, and Other Items | £0.50bn | ||
| Profit Before Tax | £7.42bn | ||
| Taxation | £1.93bn | Effective Tax Rate of c.26%, in line with recent average. | |
| Profit for FY24 | £5.49bn | ||
| Shares in Issue | 65.50bn | £2bn share buyback programme completed. | |
| Basic EPS | 8.38p | ||
| Target Price | 67p (BUY) | ||
Lloyds continues to hold up better than most of its peers as it traverses the tough operating environment as a result of high interest rates. Its more affluent customer base has been its pillar of strength as impairments have come in surprisingly lower time after time. What’s more, the group’s structural hedges continue to provide a much-needed tailwind. As such, it’s no surprise to see the bottom line continuing to grow.
Aside from that, the fact that deposits and mix shifts are starting to normalise should see a dissipating headwind going into FY24. While I imagine H1 will be slightly more challenging, the improving rate outlook combined with a boost from structural hedge income in H2 should result in healthy growth in FY24. Therefore, the bearishness on the stock isn’t truly justified when examining the fundamentals on a deeper level.
More lucratively, with CET1 now way above the lender’s target of 13.5%, excess capital returns either via buybacks and/or a special dividend cannot be ruled out. With its other businesses also seeing strong growth, I imagine a strong RoTE can be expected. On that basis, I don’t believe the stock should be trading anywhere near its current levels, especially below its TNAV per share. Even in a downside scenario, Lloyds shares till warrant a Buy.
John Choong, Senior Equity Research Analyst
Please note: John Choong has positions in Lloyds. These stock analysis reports are not personal recommendations or advice and should never be treated as such.
The value of your investments (and any income from them) can go down as well as up and you may not get back the full amount you invested. Past performance is not a reliable indicator of future performance. Investments should be considered over the longer term and should fit in with your overall attitude to risk and financial circumstances.
- Learn how to invest in the FTSE100
- Have you considered transferring your pension?
- Find the best trading platforms