
My AJ Bell share price forecast includes a 360-degree examination to determine whether investors should bank on this stock to perform.
This stock analysis report goes into detail on AJ Bell’s financial position, competitive strengths, industry outlook, valuation metrics, and analysts’ predictions to uncover whether AJ Bell shares actually present a golden long-term opportunity.
Read On: To find the AJ Bell share price forecast and my price target.
- AJ Bell Share Price (LON:AJB)
- AJ Bell Background
- AJ Bell Business Model
- AJ Bell Earnings Breakdown
- AJ Bell Financials
- AJ Bell Competitive Advantage
- AJ Bell Shortcomings
- What is the Dividend Forecast for AJ Bell Shares?
- Are AJ Bell Shares Cheap?
- What is the Profit Forecast for AJ Bell Shares?
- What is the AJ Bell Share Price Forecast?
- What is the Price Target for AJ Bell Shares?
- Are AJ Bell Shares a Buy, Sell, or Hold?
AJ Bell Background
AJ Bell is one of the UK’s top online brokerages. The company specialises in providing investment management and advisory services to retail investors. Founded in 1995 by Andy Bell and Nicholas Littlefair, it has since become one of the leading players in the UK’s investment and savings industry.
It offers a wide range of financial products and services such as ISAs, SIPPs, investment vehicles, and savings accounts. Alongside that, the firm also offers a range of financial planning services that include investment advice, retirement planning, and inheritance tax planning.
AJ Bell shares trade on the London Stock Exchange and are constituents of the FTSE 250.
Find Out: How easy it is to buy AJ Bell shares in 6 simple steps.
AJ Bell Business Model
As a broker, AJ Bell makes its money through a variety of revenue streams, encompassing fixed fees, ad valorem income, and transaction charges. The bulk of its sales usually stems from its advised services platform, which allows financial advisers to manage and administer their clients’ investment portfolios. On top of that, AJ Bell also generates revenue from its D2C platform and other non-platform means.
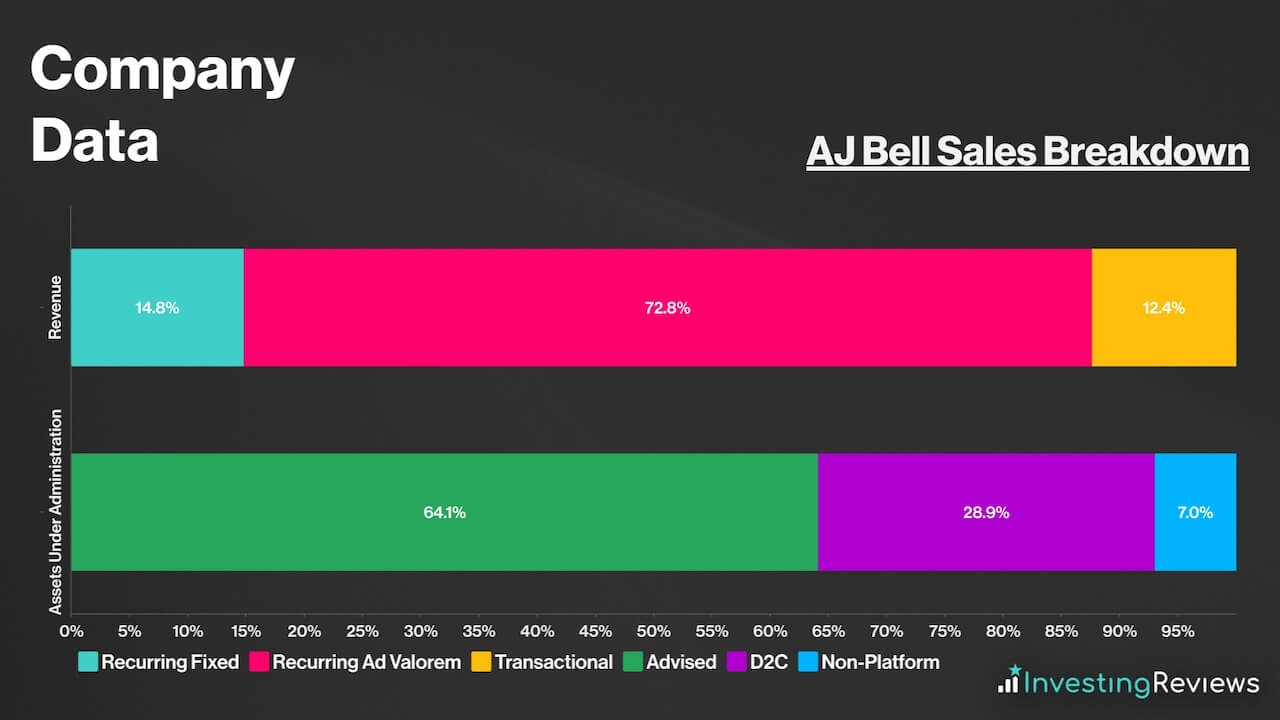
Within recurring fixed revenue, the majority of its revenue comes from administration fees and media revenue. This includes items like annual pension fees, transactional dealing fees, and pension scheme activity fees.
Meanwhile, on the D2C platform, there are clear pricing structures in place. These include a cost to online fund transactions, and a rate for online share trading. As such, those placing regular trades can benefit from lower fees. Beyond these transactional charges, AJ Bell also derives income from the investment products it offers and the advisory services available through its platform.
Furthermore, AJ Bell sustains recurring ad valorem revenue. In other words, income that’s generated as a percentage of the assets under administration (AUA). This includes custody fees, retained interest income, and investment management fees. This type of revenue is recognised uniformly over the duration in which the associated service is rendered, ensuring financial stability and transparency for both the company and its clients.
AJ Bell Earnings Breakdown
AJ Bell operates a brokerage business model for the most part, and earns its profits from fees and commissions from investors using its investment platform and related services.
Nonetheless, the profitability of the brokerage can vary based on market conditions, the performance of its investment products, the number of clients utilising its services, and its ability to generate returns on cash. This is partially why profit margins have been rather volatile lately. Still, considering the market it operates in, it’s no surprise to see AJ Bell boast incredibly lucrative profit margins (>30%).
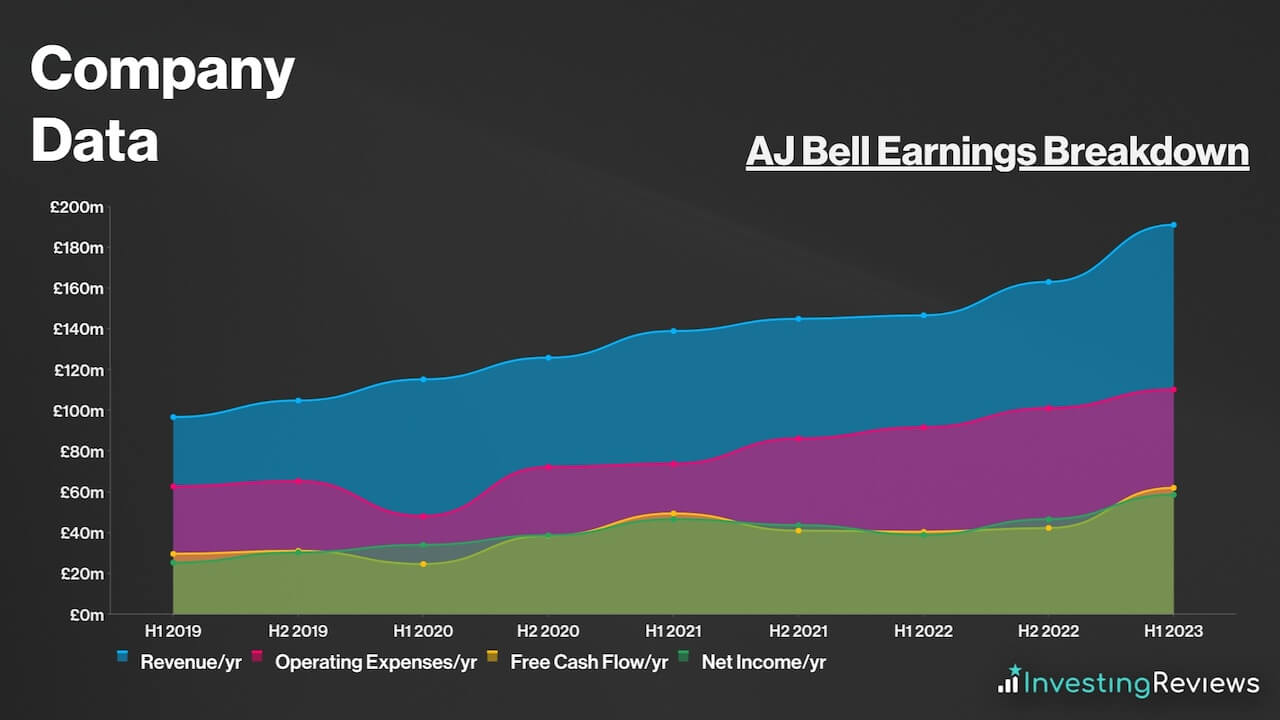
The group has a relatively diverse income base, albeit one that is reliant on ad valorem revenue, which accounts for almost three quarters of total revenue, which isn’t necessarily a bad thing.
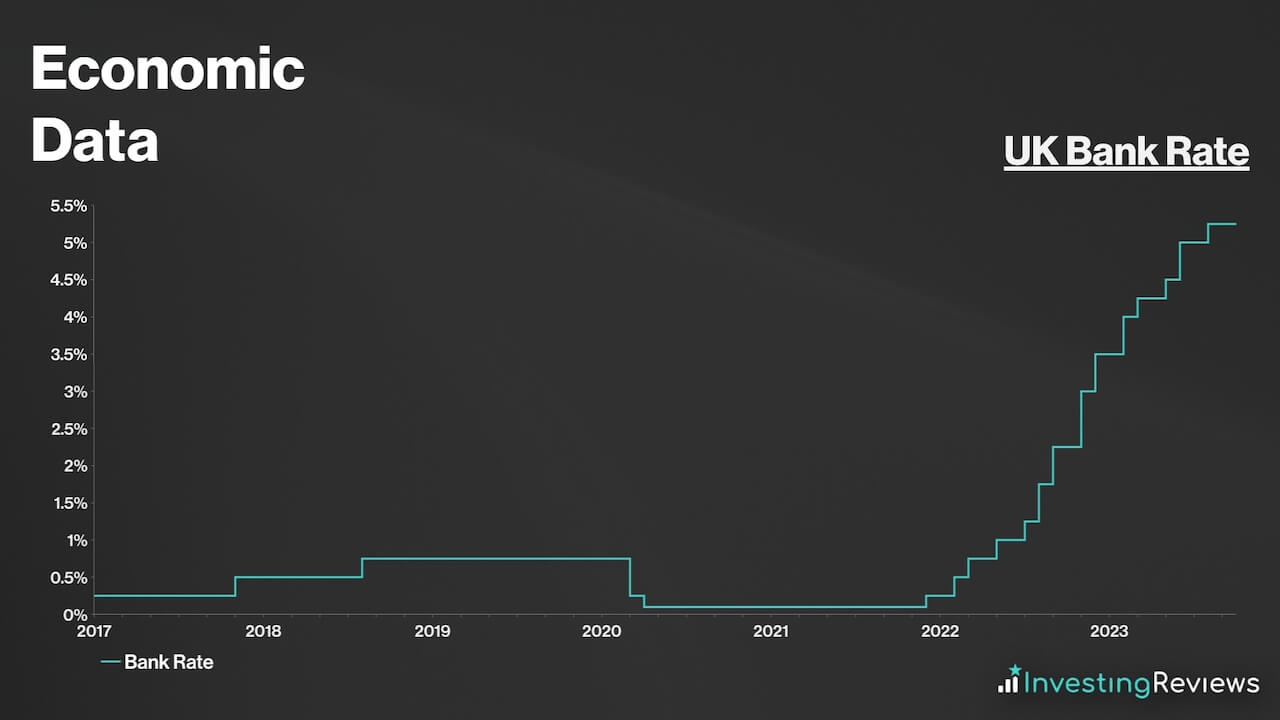
As interest rates have risen, there’s been a fall in trading volume overall, but a substantial increase in ad valorem revenue. As such, AJ Bell appears to be a net beneficiary despite higher interest rates, as elevated cash balances have more than made up for falling investor activity. This is because the broker charges a percentage of its AUA, ensuring steady income regardless of the performance of the stock market, as long as its AUA remains steady.
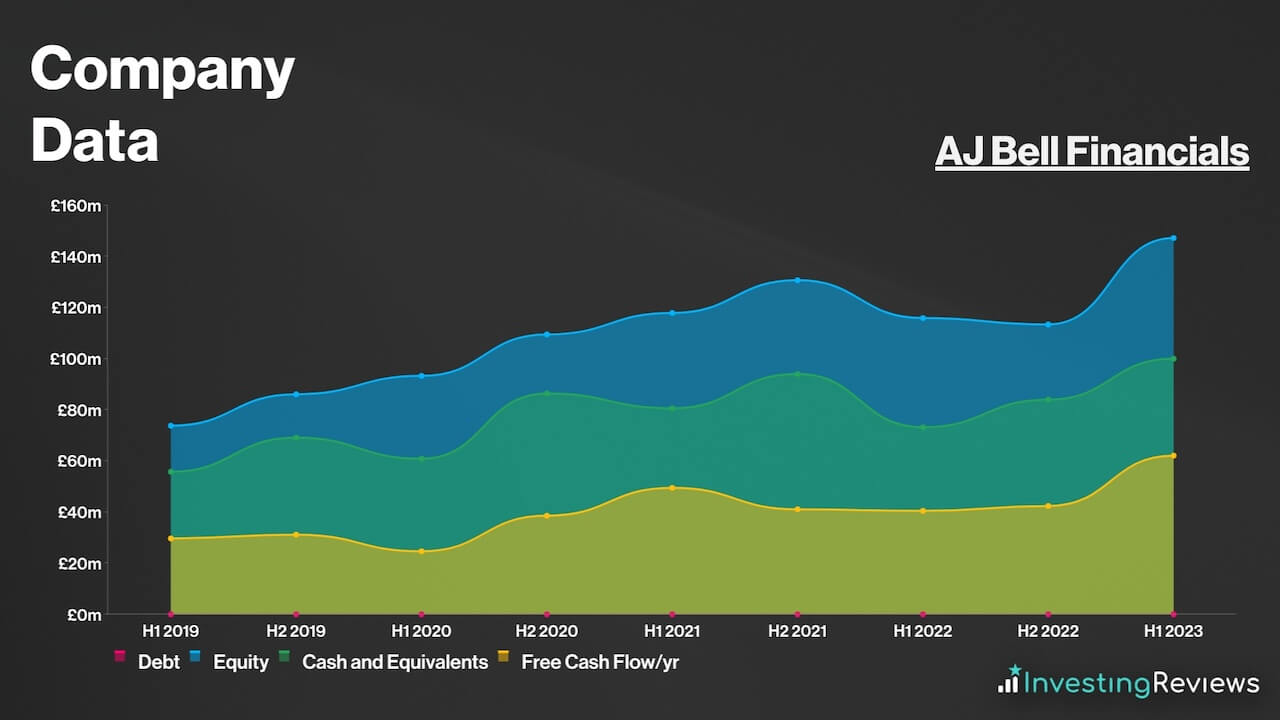
AJ Bell Financials
On the face of it, AJ Bell’s balance sheet is flawless, as its current assets trump its current liabilities by £129m. This is considered to be a norm in the brokerage industry, especially for giant brokers as they require significant cushions to absorb the impact of a potential crash in financial markets.
Nevertheless, there are other metrics that might better indicate the conglomerate’s health:
- Operating Margin: Based on operating profit as a percentage of total revenue.
- Debt Coverage: The company’s leverage by examining its debt-to-equity ratio. A high and increasing ratio may indicate financial risk, while a stable or decreasing ratio suggests stability.
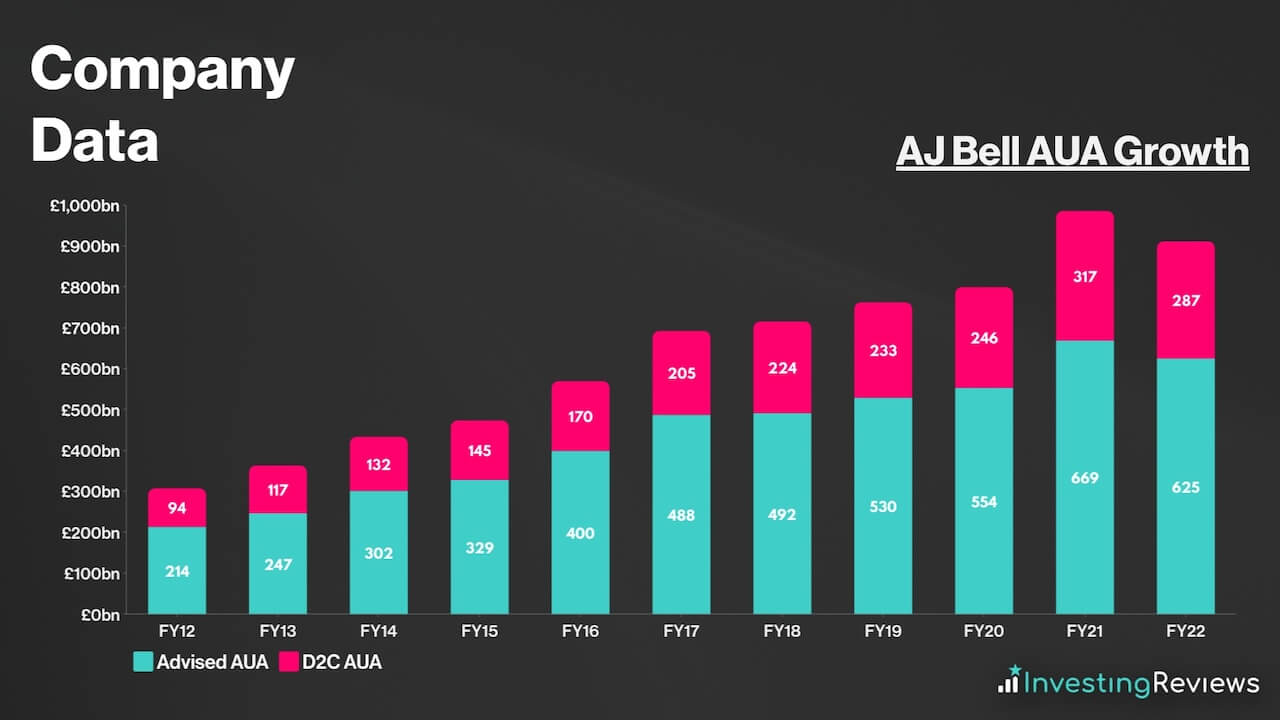
- Assets Under Administration/Management (AUA): Total market value of all the financial assets which an individual or financial institution owns.
| Metrics | AJ Bell | Industry Average |
|---|---|---|
| Operating Margin | 40.1% | 37.8% |
| Debt-to-Equity Ratio | 0% | 12.6% |
| AUA | £73.8bn | £61.3bn (ex. Charles Schwab) |
Data source: Hargreaves Lansdown, AJ Bell, CMC Markets, IG, Charles Schwab
With virtually no debt, the FTSE 250 stalwart should have sufficient liquidity to continue operating in the coming years, as long as it continues to generate cash at these levels. That being said, it’s worth noting that AJ Bell doesn’t have any credit facilities. This means that it doesn’t have the option to inject more liquidity into the business if it needs to.
AJ Bell Competitive Advantage
Having an economic moat (competitive advantage) over competitors is crucial in competitive industries such as brokerage services, where profit margins can quickly fall off, depending on the interest rate environment.
As such, AJ Bell’s main competitive advantage would be its size. Although it still lags behind the market leader, Hargreaves Lansdown in being the UK’s largest brokerage, it still holds a sizeable market share amongst investors for AUA, and is renowned as a mainstay of the brokerage industry.
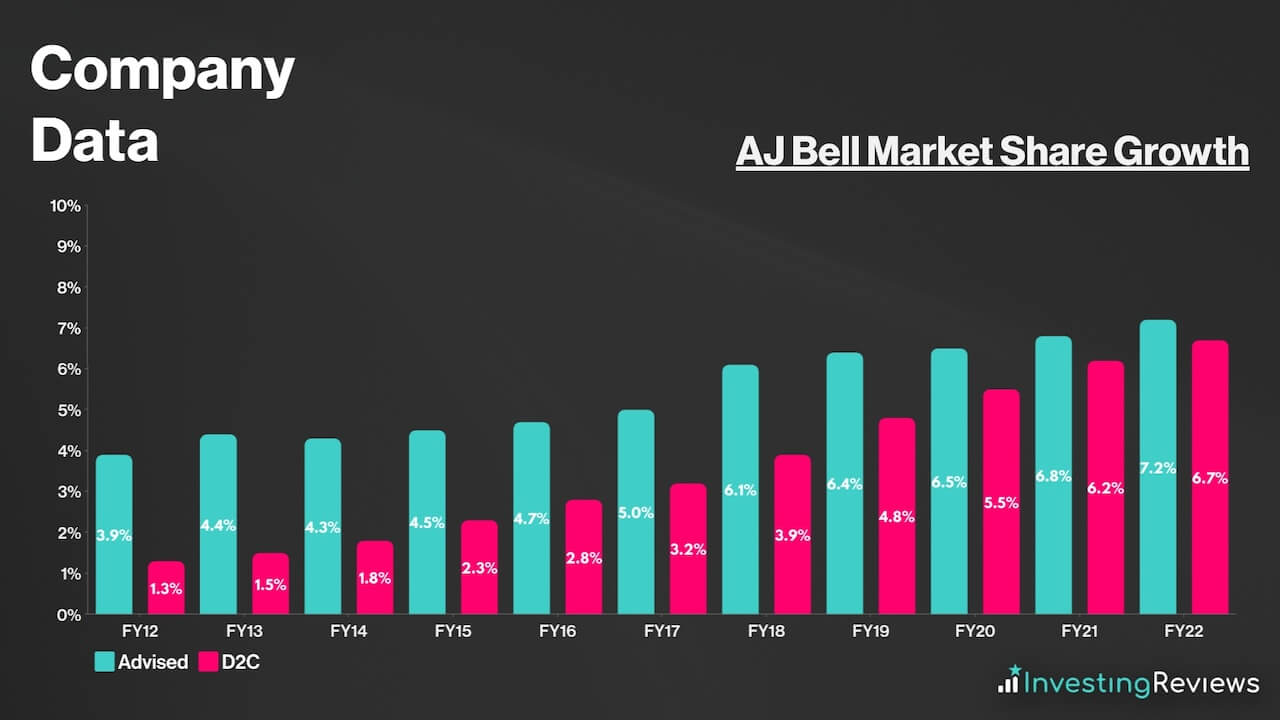
To date, however, its robust digital platform offers clients a seamless and user-friendly experience, allowing individuals to manage their investments efficiently. This user-centric approach enhances customer loyalty and draws in new investors, particularly in the ever-expanding retail investment market. With a 12% increase in clients over the past year, AJ Bell remains an attractive platform for Britons to invest.
Moreover, as noted above, the FTSE 250 constituent has diversified revenue streams, which include ad valorem revenue, transactional revenue, and recurring fixed fees. This provides resilience against market volatility.
Aside from that, AJ Bell also has a rather affluent customer base. With its target market being investors who tend to have families and are in higher income deciles, these clients are more immune to ‘pricey’ fees and would rather pay higher fees for more assurance of safety when investing lump sums.
AJ Bell Shortcomings
Despite being such a giant in the brokerage space, AJ Bell also has its fair share of weaknesses. This could put investors off when buying AJ Bell shares.
For one, AJ’s main weakness would be its relatively higher cost structure compared to some of its competitors. Other brokerages offer lower fees and commissions for trading and managing investments. This cost differential has led some analysts to question whether the premium they pay for AJ Bell’s services is justified.
Despite growing its market share over the long term, it’s worth noting that the corporation operates in a market with various well-established players. This intense competition can make it challenging for the company to acquire and retain clients, especially in the face of price wars and promotional offers from competitors.
Moreover, AJ Bell’s client base is heavily concentrated within the UK. This leaves it vulnerable to fluctuations in the UK economy, regulatory changes, and market conditions specific to the region. A significant economic downturn or regulatory shift could potentially have a more pronounced impact on profits as compared to financial institutions with a more diversified international presence.
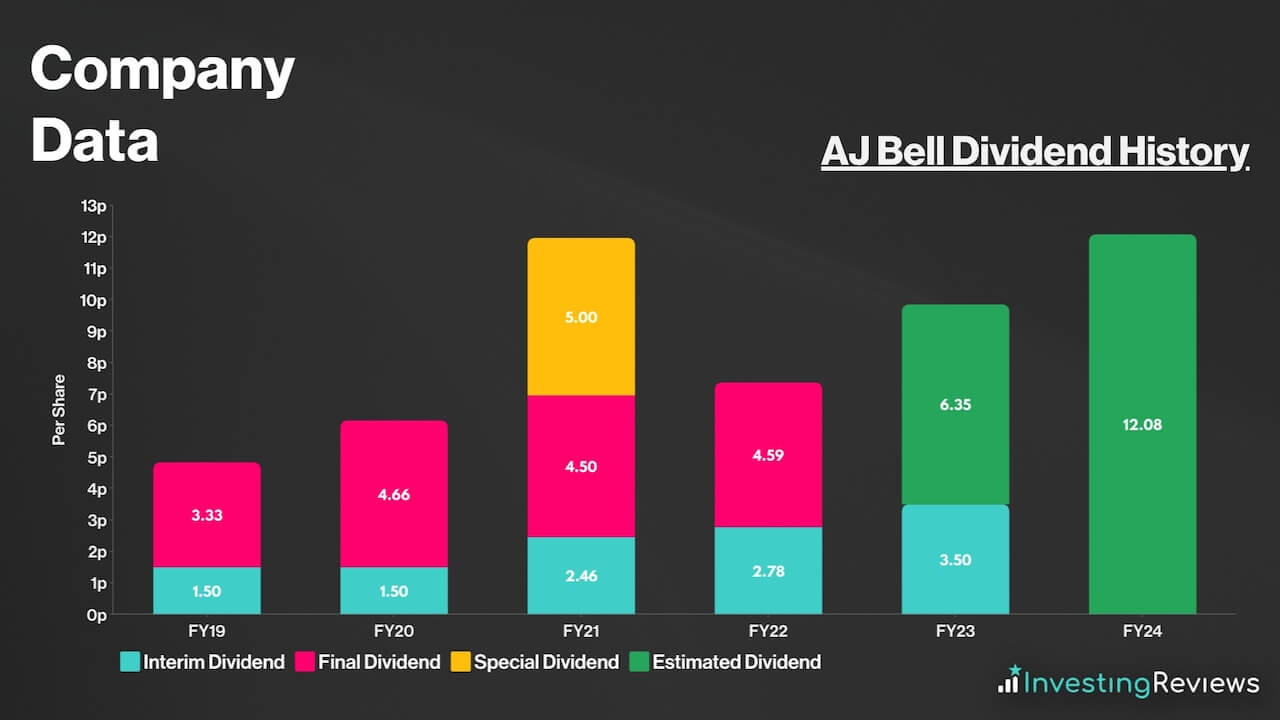
AJ Bell pays a dividend and has been paying dividends since its IPO in 2018 and even through the pandemic.
For that reason, AJ Bell shares are dent picks among dividend investors seeking passive income. This is due to the stock’s growing payouts over the years along with the organisation’s commitment to having a progressive dividend. The board also considers paying a special dividend every year end to return any surplus capital, which is a huge plus for long-term investors. More importantly, its dividends are well covered at 1.5x.
AJ Bell is expecting to continue paying a dividend for the foreseeable future. Currently, analysts are forecasting dividends to rise over the next two years.
AJ Bell shares are currently trading at a premium when compared to their industry competitors. This makes it more expensive than all of its major UK peers. It’s hard, therefore, to conclude that the stock is somehow cheap. Even so, it’s worth noting that the stock continues to trade below its historical averages with analysts indicating growth potential from its earnings.
Among the 13 qualified analysts covering AJ Bell shares, the consensus is for AJ Bell to grow its top and bottom lines over the next two years, with a return to trading volumes being the main catalyst for this.
| Metrics | FY22 (Reported) | FY23 | FY24 |
|---|---|---|---|
| Revenue | £163.9m | £214.5m | £237.3m |
| Diluted EPS | 11.35p | 15.47p | 16.25p |
Data source: AJ Bell, Financial Times
AJ Bell shares currently have an average Buy rating from several brokers. With an average price target of 370p, brokers seem to agree that there’s upside potential for AJ Bell shares over the next 12 months.
| Date | Brokerage | Rating | Price Target |
|---|---|---|---|
| 11/10/2023 | Barclays | Hold | 310p |
| 26/9/2023 | Morgan Stanley | Sell | 275p |
| 6/9/2023 | RBC | Hold | 345p |
| 12/6/2023 | Shore Capital | Buy | N/A |
| 2/6/2023 | Jefferies | Buy | 370p |
| 25/5/2023 | Numis | Buy | 488p |
| 2/5/2023 | Berenberg | Hold | 307p |
Data source: Market Screener
My price target for AJ Bell shares was last updated on 18th October 2023.
| Metrics | Adjusted FY23 (Projected) | Comments | |
|---|---|---|---|
| Advised Revenue | £96.8m | c.48% of total revenue — largely driven by increasing ad valorem revenue and higher interest rates | |
| D2C Revenue | £102.0m | c.48% of total revenue — largely driven by increasing ad valorem revenue and higher interest rates. | |
| Non-Platform Revenue | £14.2m | c. 6% of total revenue – broadly in line with growth trajectory. | |
| Revenue | £213.0m | c.30% growth — slightly higher than H1 revenue margin, at c.30bps with AUA of c.£71bn. | |
| Operating Costs | £130.0m | c.61% of revenue — lower vs FY22 as cost savings kick in, combined with higher margins from ad valorem revenue. | |
| Operating Profit | £83.0m | ||
| Finance Income | £1.8m | Higher interest income on cash balances. | |
| Finance Costs | £0.9m | Relatively steady costs from lease liabilities. | |
| Profit Before Tax | £83.9m | ||
| Taxation | £18.5m | Effective Tax Rate of c.22%, in line with guidance. | |
| Profit for FY24 | £65.4m | ||
| Shares in Issue | 412.6m | ||
| Underlying Diluted EPS | 15.85p | ||
| Price Target | 317p (BUY) | ||
AJ Bell has continued to make gains in terms of AUA and clients despite offering a service that is more expensive than many of its peers. In recent quarters, this pattern has shown few signs of abating, highlighting the positive impact of a strong brand image and reliability amongst upper income deciles when it comes to managing money.
In turn, this explains why the stock continues to trade at a premium to its peers, including market leader Hargreaves Lansdown. Considering the amount of growth potential, I share the same sentiment and believe that AJ Bell deserves its premium to the market. That said, I’m also aware of the lower levels of investor interest over the past 18 months and have opted to price it on a lower-than-average multiple.
Despite that, my Buy rating notes the continued positive impact of higher interest rates on ad valorem revenues. With interest rate forecasts in mind, this tailwind looks set to continue unless UK regulators puts more pressure on brokerages to provide customers with better rates of return on cash. But even so, risks to the downside remain relatively limited in relation to the potential upside.
Dr. James Fox, Equity Research Analyst
Please note: James Fox has no positions in AJ Bell. These stock analysis reports are not personal recommendations or advice and should never be treated as such.
The value of your investments (and any income from them) can go down as well as up and you may not get back the full amount you invested. Past performance is not a reliable indicator of future performance. Investments should be considered over the longer term and should fit in with your overall attitude to risk and financial circumstances.
- Learn how to invest in the FTSE100
- Have you considered transferring your pension?
- Find the best trading platforms