
My Barclays share price forecast includes a 360-degree examination to determine whether investors should bank on this stock to perform.
This stock analysis report goes into detail on Barclays’ financial position, competitive strengths, industry outlook, valuation metrics, and analysts’ predictions to uncover whether Barclays shares actually present a golden long-term opportunity.
Read On: To find the Barclays share price forecast and my price target.
- Barclays Share Price (LON:BARC)
- Barclays Background
- Barclays Business Model
- Barclays Earnings Breakdown
- Barclays Financials
- Barclays Competitive Advantage
- Barclays Shortcomings
- What is the Dividend Forecast for Barclays Shares?
- Are Barclays Shares Cheap?
- What is the Profit Forecast for Barclays Shares?
- What is the Barclays Share Price Forecast?
- What is the Price Target for Barclays Shares?
- Are Barclays Shares a Buy, Sell, or Hold?
Barclays Background
Barclays is a British universal bank and is known to be part of the big five banks in the UK. It’s also the largest investment bank in the UK and Europe, with a retail and commercial banking arm boasting over 48m customers worldwide.
As a whole, it offers a wide range of financial services which include retail banking, investment banking, asset management, and insurance. Barclays was the first institution to issue a credit card in 1966, and is now one of the biggest issuers in the UK with over 15m customers.
Barclays shares trade on the London Stock Exchange and are constituents of the FTSE 100.
Find Out: How easy it is to buy Barclays shares in 6 simple steps.
Barclays Business Model
As a bank, Barclays makes its money through different means as compared to a traditional business. It operates based on leverage — where a company uses borrowed money/debt to purchase assets in order to generate income and sell them later on for a profit.
In this instance, Barclays uses investors’ and customers’ funds to issue loans. It then generates income from the interest it charges on those loans. A portion of those profits are then paid into customers’ savings accounts as interest. The difference between what it earns from loans and what it pays in interest is its profits. This is otherwise known as net interest income.
Barclays splits itself into two main divisions — Barclays UK and Barclays International. The former is host to personal banking, business banking, and Barclaycard within the UK. On the other hand, the latter is where it earns most of its money — from trading, fees, issuing loans, and other means, such as underwriting securities.
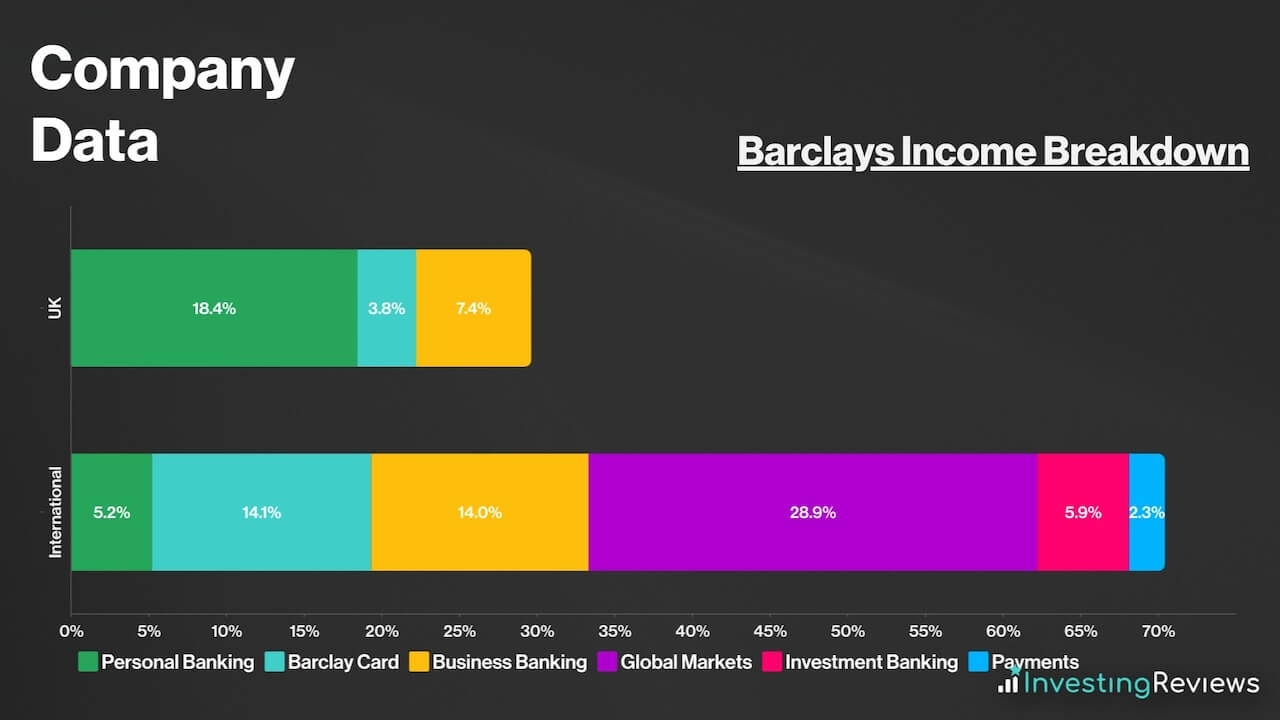
To start with, Barclays UK earns most of its money from net interest income. That said, Barclays also earns a small portion of income from fees it charges to clients to manage their wealth. It also charges customers to use its Barclaycard. These fees range from annual fees to late payments and transaction fees.
Meanwhile, on the international front, Barclays earns the bulk of its income from its Global Markets arm, but more specifically through Fixed Income, Currency, and Commodities (FICC). It usually earns a little more from Investment Banking fees too, but due to the current macroeconomic and market environment, this has remained muted with a lack of IPOs, although corporate income remains rather robust.
Barclays Earnings Breakdown
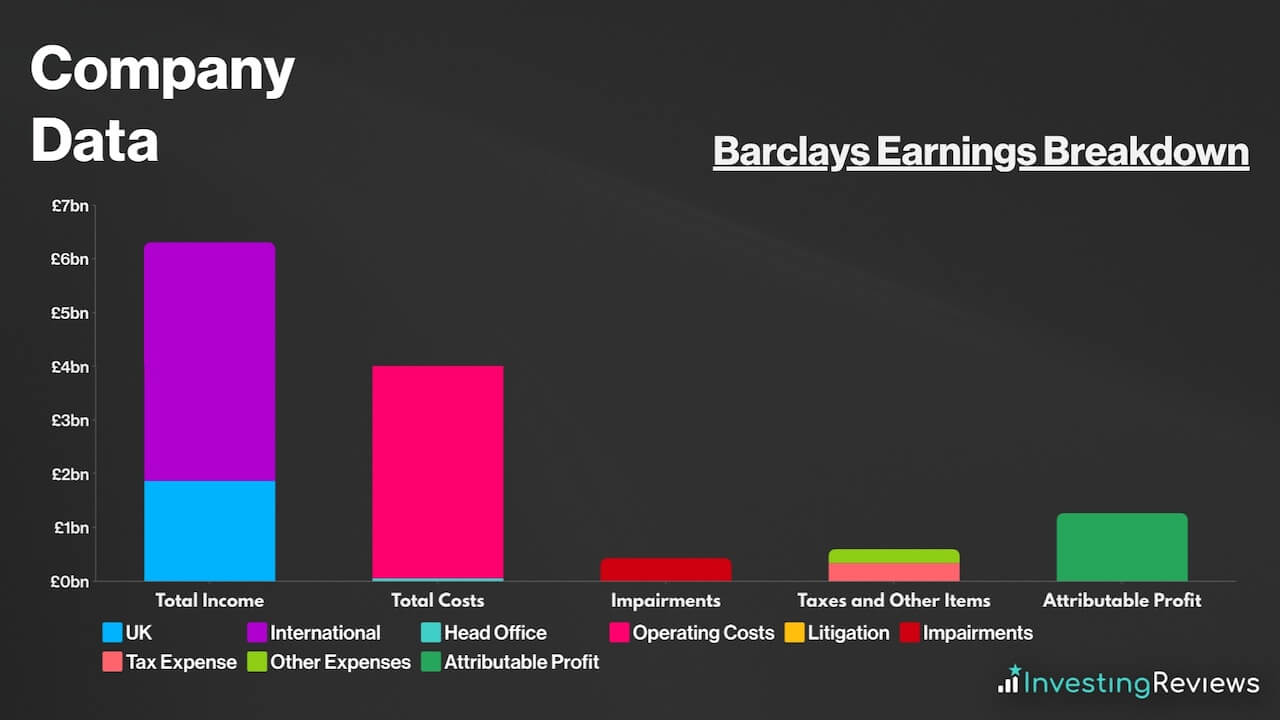
Barclays is a profitable business, and has been since the great financial crisis in 2008. The lender has been generating healthy profit margins which rose rapidly in 2021. Nonetheless, this has slowed down over the past year or so due to the poor market environment, although its profit margins still remain above their pre-pandemic levels.
That being said, profits for Barclays are a double-edged sword in relation to higher interest rates. That’s because, on the one hand, a higher bank rate allows Barclays to charge higher interest rates for the loans it charges — but on the other hand, higher borrowing costs mean a slower market for its investment banking division.
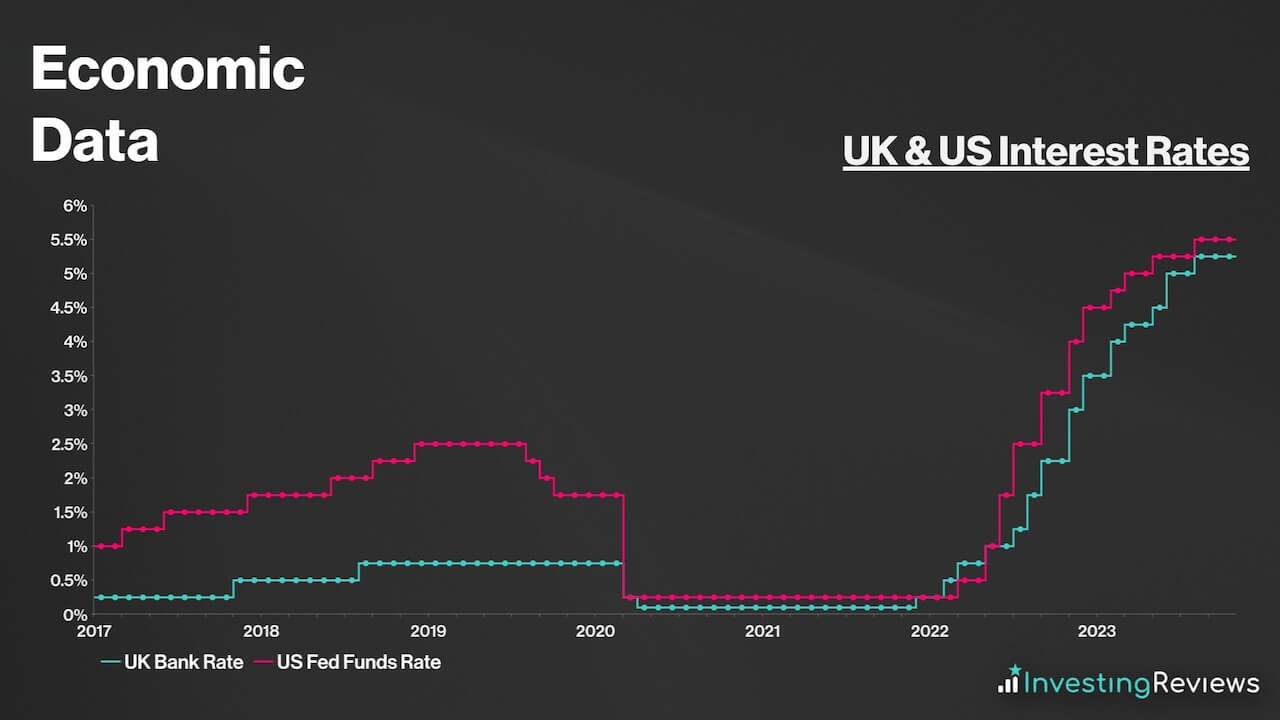
As such, Barclays is more likely to thrive when interest rates are in the ‘goldilocks zone’. This is when rates are high enough for the Blue Eagle bank to earn substantial interest income while seeing low defaults, but also low enough to stimulate borrowing to drive its investment banking income.
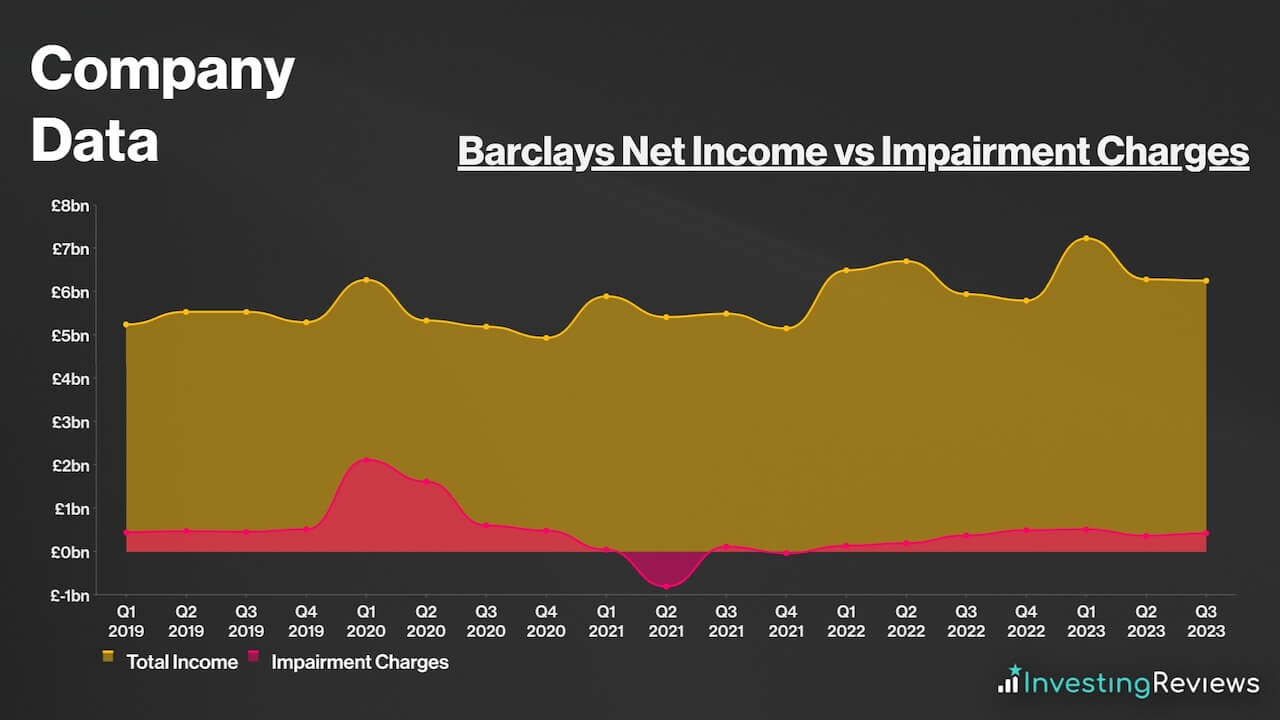
Having said that, it’s worth cautioning that higher rates can also trigger higher impairments, as more customers default on their loans from having to pay higher interest. As a consequence, impairments tend to rise and offset higher profits. Barclays will be hoping that the bank rate eventually consolidates at a level that many refer to as the ‘goldilocks zone’, where it can make high profits while seeing low defaults.
Barclays Financials
On the face of it, Barclays’ financials don’t look the best due to its high debt-to-equity ratio. In spite of that, it’s worth noting that this is because as mentioned above, Barclays is a high-leverage business.
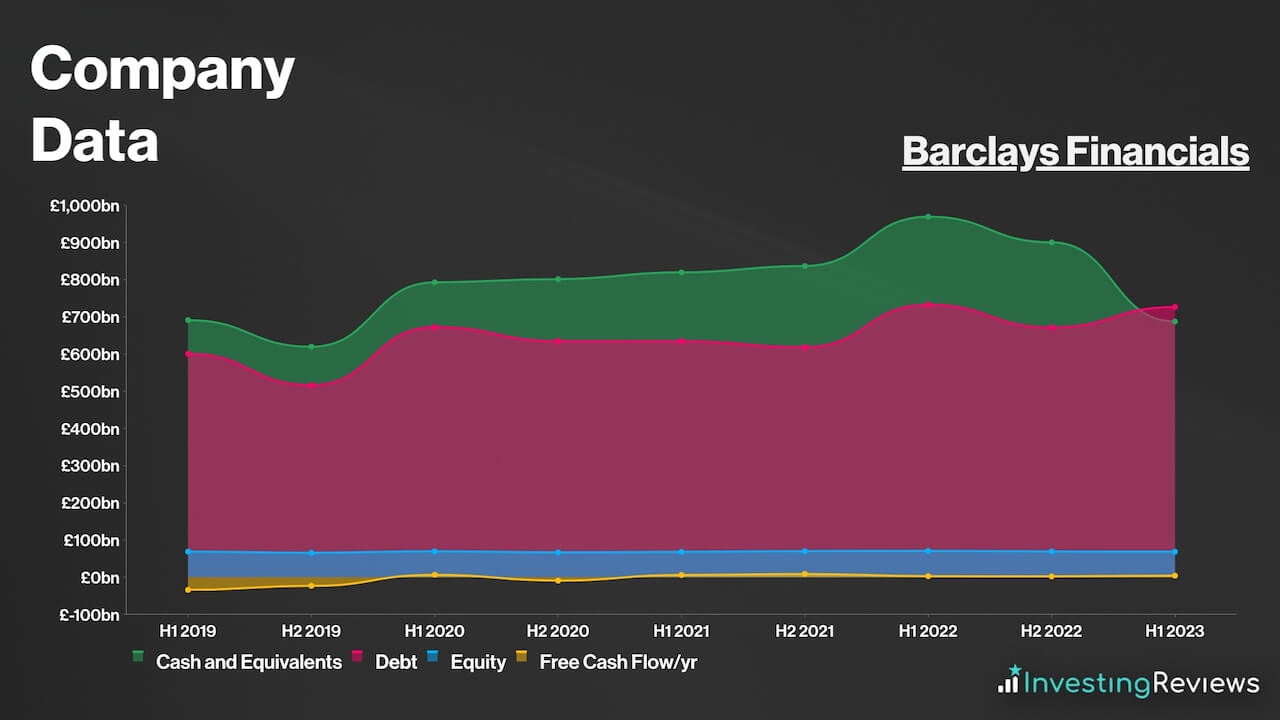
Thus, other metrics might better indicate the bank’s health:
- Asset Quality Ratio: The quality of a bank’s loan portfolio. It measures the ratio of non-performing loans (NPLs) to total loans.
- CET1 (Common Equity Tier 1) Ratio: The amount of highest-quality capital a bank holds to support its risk-weighted assets. It’s a key measure of a company’s underlying financial strength.
- Liquidity Coverage Ratio: The amount of highly liquid assets (eg. cash) to meet short-term obligations (eg. withdrawals).
- Return on Tangible Equity (RoTE): The measure of a company’s profitability in relation to its tangible equity. It’s one of the better-known metrics to measure a bank’s profitability. Banks tend to target a RoTE between 10% to 15%.
| Metrics | Barclays | Industry Average |
|---|---|---|
| Asset Quality Ratio | 0.09 | 0.19 |
| CET1 Ratio | 14.0% | 14.3% |
| Liquidity Coverage Ratio | 159% | 147% |
| RoTE | 11.0% | 16.2% |
Data source: Barclays
So, based on the indicators above, it’s safe to say that Barclays as a bank, is in a pretty healthy position. Its CET1 ratio may be lower than the industry average, but it’s worth stating that it’s still comfortably above regulatory requirements. And even so, it’s got a robust asset quality ratio and higher liquidity coverage.
Barclays Competitive Advantage
Having an economic moat (competitive advantage) over competitors is crucial in saturated industries such as banking, where profit margins can be volatile, depending on the interest rate environment.
As such, Barclays’ main competitive advantage would be its size. It’s the UK’s second-largest bank and Europe’s largest investment bank. As a result of this, Barclays has the widest economic moat any company desires — a ‘too big to fail’ status. This is due to its ties with the rest of the economy, as a bank failure of this size could be catastrophic for the entire nation.
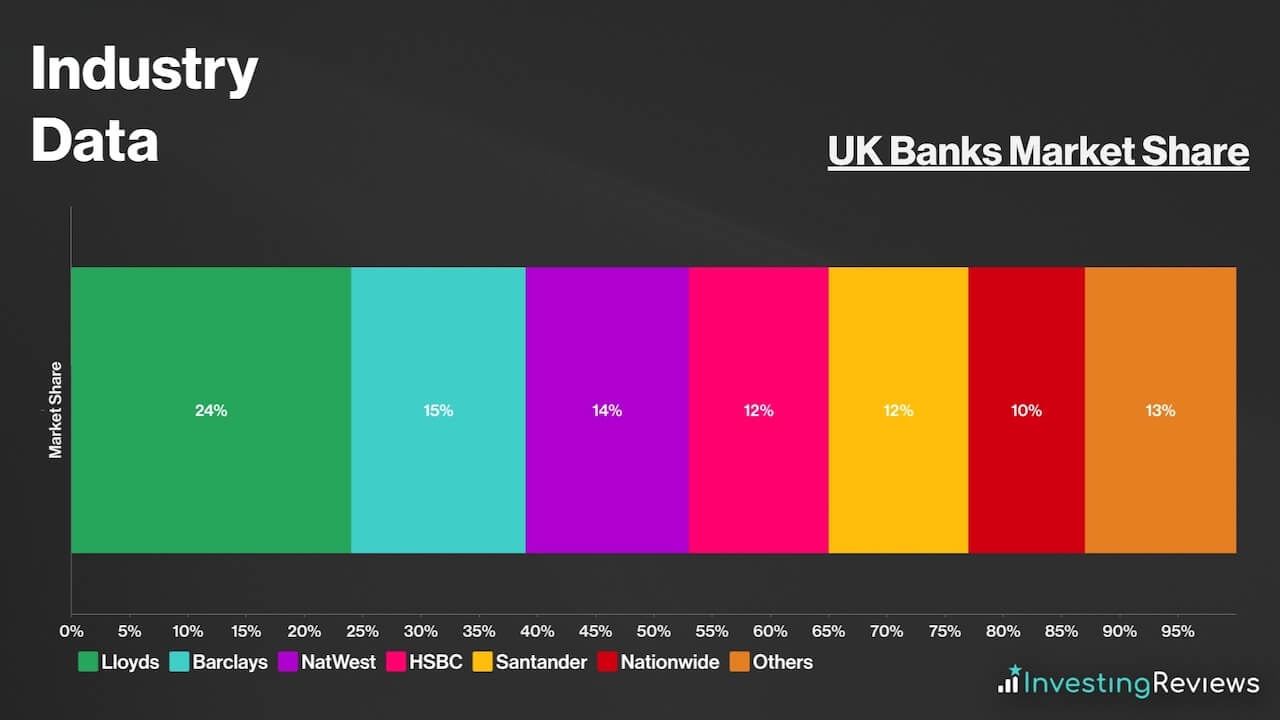
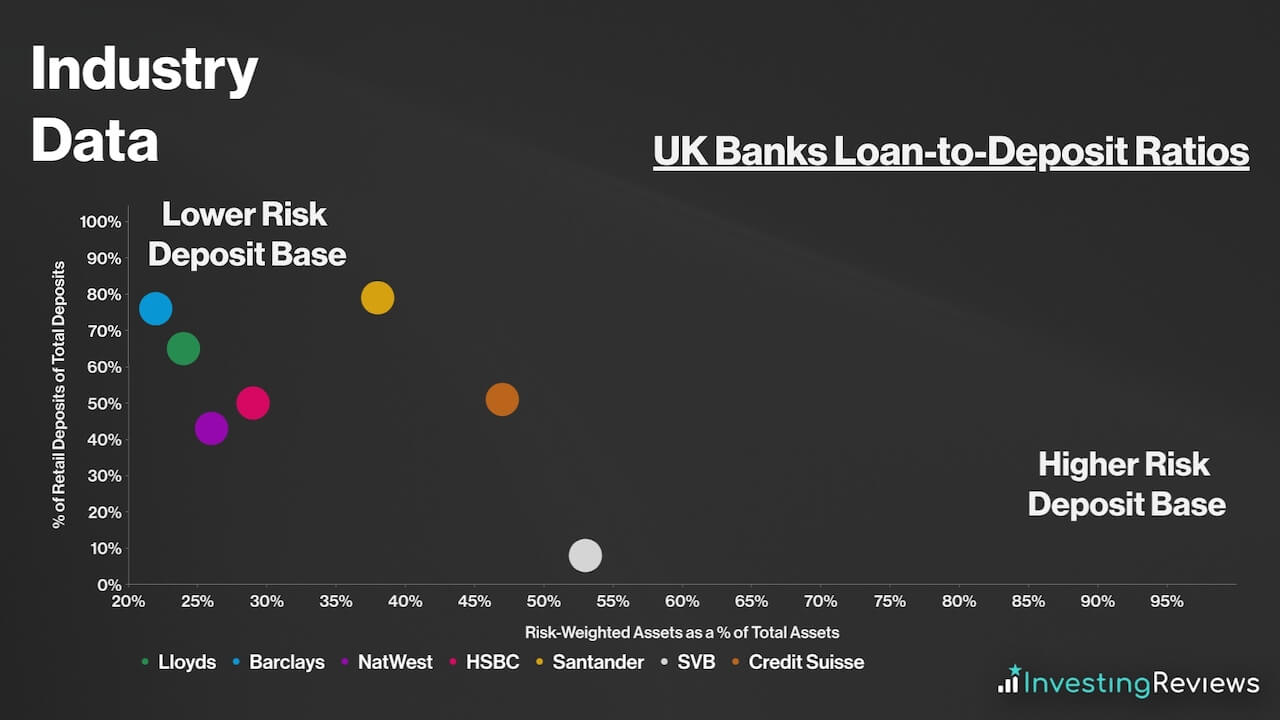
Aside from that, Barclays has also got an extremely robust capital base as evidenced by its high CET1 ratio, countercyclical capital buffers, and lower-risk deposit base. This has allowed it to be more immune to the banking crisis which was sparked by the collapse of several regional banks in the US.
Meanwhile, any signs of an economic recovery could spark a further recovery in the investment banking sector, and subsequently, the Barclays share price. With the Fed now seemingly done with its rate hikes, rate cuts will eventually come into play. When this does eventually occur, Barclays will be one of the main beneficiaries of a rebounding stock market with profits flooding in from higher trading volumes, deal-making, and debt creation.
In addition, the institution has opportunities in many emerging markets. Hence, given the company’s strong presence in those geographies, Barclays is well-positioned to benefit from the rapid growth of these markets for the years and decades to come.
Barclays Shortcomings
Despite being such a giant in the banking space, Barclays also has its fair share of weaknesses. This could put investors off when buying Barclays shares.
For one, Barclays’ main weakness would be its balance sheet. There’s no doubt that its financials are stellar, but only as a bank. On paper, banks have one of the worst balance sheets due to their leverage-heavy operating model. This means that they’re susceptible to credit crunches and liquidity crises (bank runs). The collapse of several regional banks in the US only goes to show how fragile these institutions can be.
Moreover, Barclays has to deal with much stricter regulations in the UK as compared to the US. The Bank of England requires banks in the UK to operate with higher capital buffers. This is seen as a strength in the eye of customers given the added security it brings. However, it also limits a bank’s earnings potential.
But on a micro scale, Barclays also has a few inherent problems. Mainly, it’s got a bad history with regulators, having forked out billions in remuneration and litigation charges due to its lacklustre ability to handle risks, as well as its own mishaps regarding the issuance of securities.
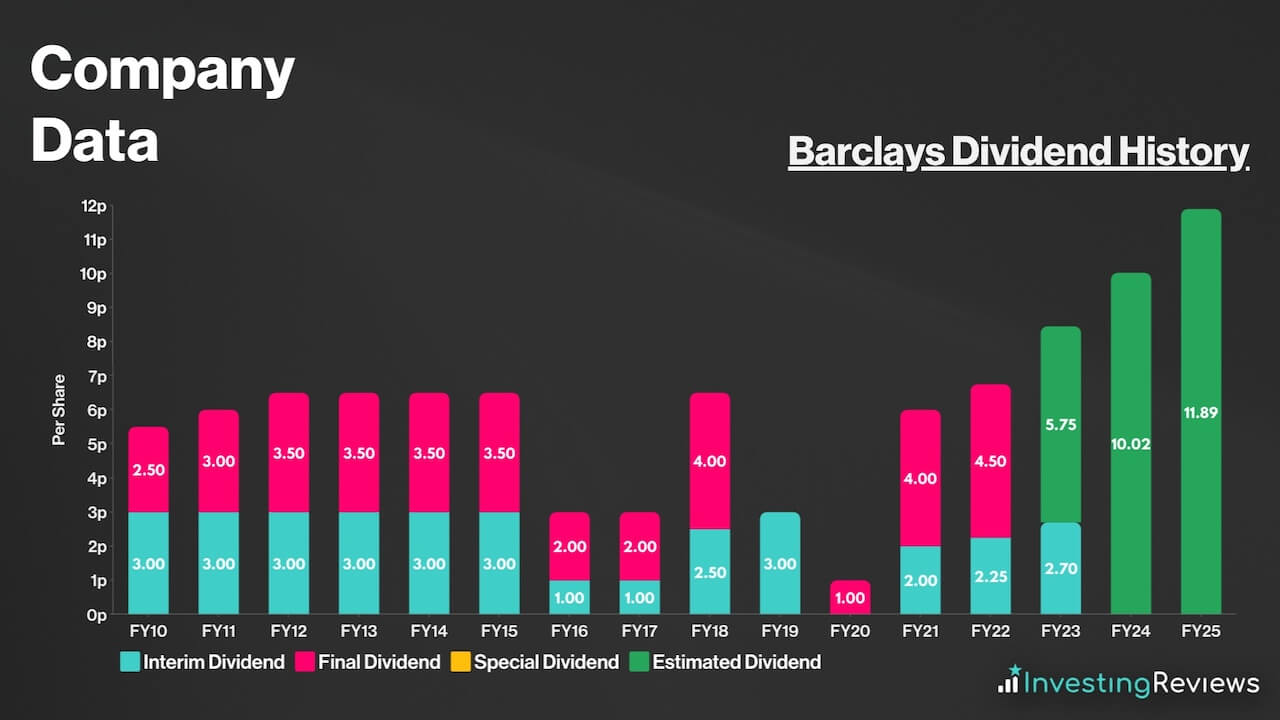
Barclays pays a dividend and has been paying dividends as far back as 2005; even through the great financial crisis. This makes Barclays a dividend aristocrat given its impressive track record of shareholder payments.
This makes Barclays shares decent dividend stocks to invest in for those seeking some passive income. This is due to the stock’s growing payouts over the years along with the organisation’s commitment to having a progressive dividend. More importantly, its dividends are well covered at 4.2x.
Barclays is expecting to continue paying a dividend for the foreseeable future. Currently, analysts are forecasting dividends to grow, with the dividend rising healthily over the next three years.
Barclays shares are currently trading at a massive discount when compared to their industry competitors and the FTSE 100 on an adjusted basis. What’s more, their P/B ratio sits comfortably below 1, which indicates that the stock is trading way below its book value.
Among the 18 qualified analysts covering Barclays shares, the consensus is for Barclays to grow its top and bottom lines over the next three years, with higher income from its investment banking division being the main catalyst for this.
| Metrics | FY22 (Reported) | FY23 | FY24 | FY25 |
|---|---|---|---|---|
| Total Income | £24.96bn | £25.89bn | £26.70bn | £27.53bn |
| Operating Expenses | £16.73bn | £16.16bn | £16.66bn | £17.02bn |
| Impairments | £1.22bn | £2.14bn | £2.39bn | £2.28bn |
| Profit Before Tax (PBT) | £7.01bn | £7.61bn | £7.68bn | £8.25bn |
| Adjusted Basic EPS | 30.8p | 32.0p | 33.5p | 38.7p |
| Return on Tangible Equity (RoTE) | 10.4% | 10.6% | 10.2% | 10.5% |
Data source: Barclays
Barclays shares currently have an average Buy rating from several brokers. With an average price target of 230p, brokers seem to agree that there’s upside potential for Barclays shares in the next 12 months.
| Date | Brokerage | Rating | Price Target |
|---|---|---|---|
| 24/10/2023 | Shore Capital | Buy | N/A |
| 24/10/2023 | UBS | Buy | 210p |
| 24/10/2023 | JPMorgan | Buy | 190p |
| 24/10/2023 | RBC | Buy | 205p |
| 16/10/2023 | Citi | Buy | N/A |
| 16/10/2023 | Jefferies | Buy | 300p |
| 10/10/2023 | Berenberg | Buy | 240p |
| 26/9/2023 | Morgan Stanley | Buy | 230p |
| 22/9/2023 | Deutsche | Hold | 200p |
| 28/7/2023 | Goldman Sachs | Buy | 280p |
| 21/6/2023 | BNP Paribas | Buy | 205p |
| 28/4/2023 | UBS | Buy | 240p |
| 28/4/2023 | Credit Suisse | Buy | 245p |
Data source: Market Screener
My price target for Barclays shares was last updated on 25th October 2023.
| Metrics | Statutory FY23 (Projected) | Comments | |
|---|---|---|---|
| UK Income | £7.59bn | c.3.08% net interest margin — upper end of revised guidance from encouraging deposit mix shifts as bank rate peaks. | |
| CIB Income | £13.16bn | c.1.5% contraction — Uptick in deal-making and corporate lending should help to offset some of the declines in equity and FICC underperformance. | |
| CC&P Income | £5.31bn | c.18% growth — impact of higher rates to impact household cash flows, spurring higher usage of cards. | |
| Head Office Income | £-0.2bn | In line with recent trends. | |
| Net Income | £25.86bn | ||
| Operating Costs | £15.90bn | c.61.5% of net income — slightly higher than guidance due to higher wage costs. | |
| UK Bank Levy | £0.18bn | In line with long-term average. | |
| Litigation and Conduct | £0.20bn | Slightly higher than guidance due to historical litigation issues. | |
| Other Net Expenses/Income | £0.02bn | In line with consensus. | |
| Impairments | £2.00bn | Assuming higher defaults from higher mortgage and interest rates, although still rather resilient from better-than-expected economic outlook. | |
| Profit Before Tax | £7.60bn | ||
| Taxation | £1.52bn | Effective Tax Rate of c.20%, in line with year average. | |
| Non-Controlling Interest | £0.05bn | In line with long-term average. | |
| Other Equity Instrument Holders | £1.00bn | In line with long-term average. | |
| Profit for FY24 | £5.03bn | ||
| Shares in Issue | 15.56bn | £750m share buyback programme completed. | |
| Basic EPS | 32.32p | ||
| Target Price | 225p (BUY) | ||
On the back of an upgrade from Morgan Stanley last month, Barclays shares are beginning to show some signs of recovery. The Blue Eagle bank’s stock rose 8% in September and could have a path paved higher for it as more analysts potentially upgrade their ratings.
Morgan Stanley’s own Alvaro Serrano cited the institution’s underappreciated credit card business in the US along with strong consumer strategies and profitable deals as the main reasons for his upgrade. This certainly makes sense considering the resilient spending patterns across the Atlantic. Additionally, there’s been an uptick in investment banking activity, as reported by several US big banks in their Q2 earnings.
This could spell good news for the FTSE 100 stalwart as earnings recovery on the investment banking front could boost its bottom line. After all, green shoots are beginning to sprout as IPO activity ramps up after a year-long slump. It’s for the above reasons that I echo Morgan Stanley’s Buy rating.
John Choong, Senior Equity Research Analyst
Please note: John Choong has positions in Barclays. These stock analysis reports are not personal recommendations or advice and should never be treated as such.
The value of your investments (and any income from them) can go down as well as up and you may not get back the full amount you invested. Past performance is not a reliable indicator of future performance. Investments should be considered over the longer term and should fit in with your overall attitude to risk and financial circumstances.
