My Hargreaves Lansdown share price forecast includes a 360-degree examination to determine whether investors should bank on this stock to perform.
This stock analysis report goes into detail on Hargreaves Lansdown’s financial position, competitive strengths, industry outlook, valuation metrics, and analysts’ predictions to uncover whether Hargreaves Lansdown shares actually present a golden long-term opportunity.
Read On: To find the Hargreaves Lansdown share price forecast and my price target.
- Hargreaves Lansdown Share Price (LON:HL)
- Hargreaves Lansdown Background
- Hargreaves Lansdown Business Model
- Hargreaves Lansdown Earnings Breakdown
- Hargreaves Lansdown Financials
- Hargreaves Lansdown Competitive Advantage
- Hargreaves Lansdown Shortcomings
- What is the Dividend Forecast for Hargreaves Lansdown Shares?
- Are Hargreaves Lansdown Shares Cheap?
- What is the Profit Forecast for Hargreaves Lansdown Shares?
- What is the Hargreaves Lansdown Share Price Forecast?
- What is the Price Target for Hargreaves Lansdown Shares?
- Are Hargreaves Lansdown Shares a Buy, Sell, or Hold?
Hargreaves Lansdown Background
Hargreaves Lansdown is the UK’s top online brokerage. The company specialises in providing investment management and advisory services to retail investors. Founded in 1981 by Peter Hargreaves and Stephen Lansdown, it has since become one of the leading players in the UK’s investment and savings industry.
It offers a wide range of financial products and services such as ISAs, SIPPs, investment vehicles, and savings accounts. Alongside that, the firm also offers a range of financial planning services that include investment advice, retirement planning, and inheritance tax planning.
Hargreaves Lansdown shares trade on the London Stock Exchange and are constituents of the FTSE 100.
Find Out: How easy it is to buy Hargreaves Lansdown shares in 6 simple steps.
Hargreaves Lansdown Business Model
As a broker, Hargreaves Lansdown makes its money through a variety of revenue streams. The bulk of its sales usually stems from its investment platform, where it receives fees and commissions for trades being made by investors. However, this has shifted in recent times due to poor trading volumes. On top of that, Hargreaves also generates revenue from interest income and gives financial advice as a service.
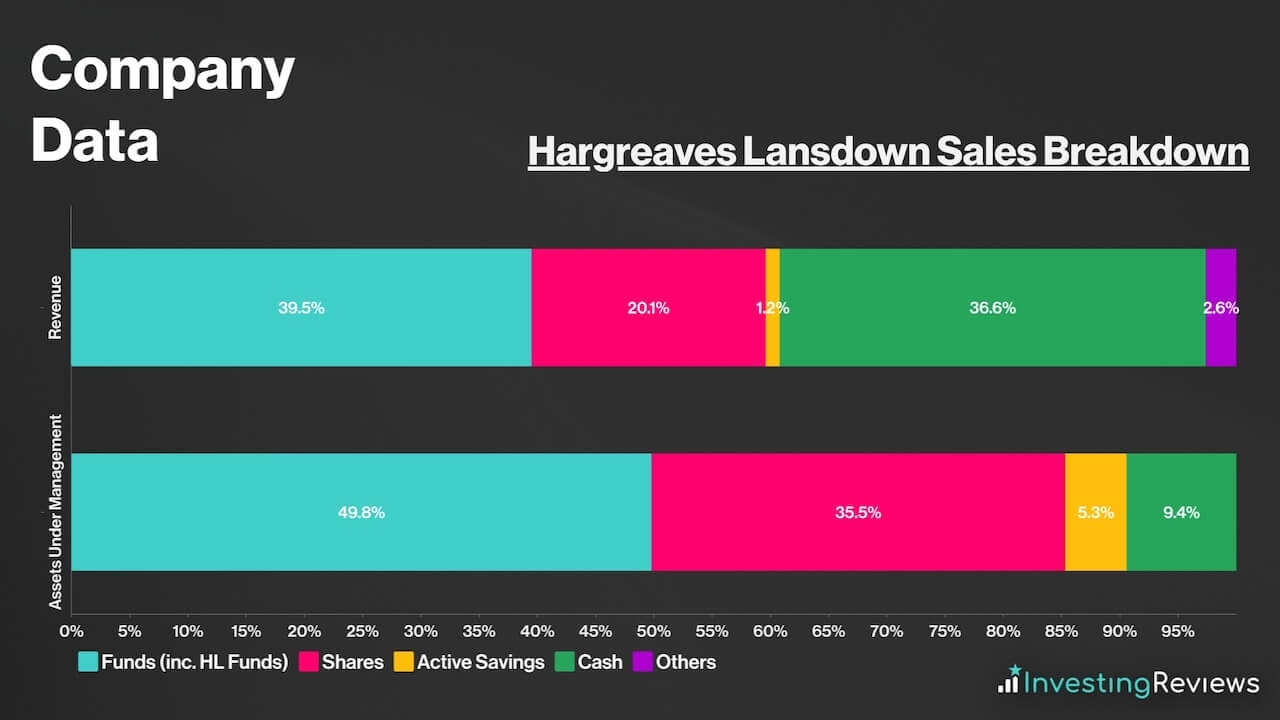
Within its investment platform, the majority of its revenue comes from platform fees — income from funds. This is followed by stockbroking commissions and management fees — income from shares. Another portion of its revenue stems from cash. This is where it uses leverage — when a company uses borrowed money/debt to purchase assets to generate income and sell them later on for a profit.
In this instance, Hargreaves deposits customer funds in high-yielding funds. A portion of this interest is then paid into customers’ savings accounts while it retains the other portion as income. The difference in interest earned and paid into customer accounts is its profits. This is otherwise known as net interest income. On top of that, cash revenue can also stem from foreign exchange fees, margin lending, and cash management fees.
Hargreaves Lansdown Earnings Breakdown
Hargreaves Lansdown operates a brokerage business model for the most part, and earns its profits from fees and commissions from retail investors using its investment platform and related services.
Nonetheless, the profitability of the brokerage can vary based on market conditions, the performance of its investment products, the number of clients utilising its services, and its ability to generate returns on cash. This is partially why profit margins have been rather volatile lately. Still, considering the market it operates in, it’s no surprise to see Hargreaves boast incredibly lucrative profit margins (>40%).
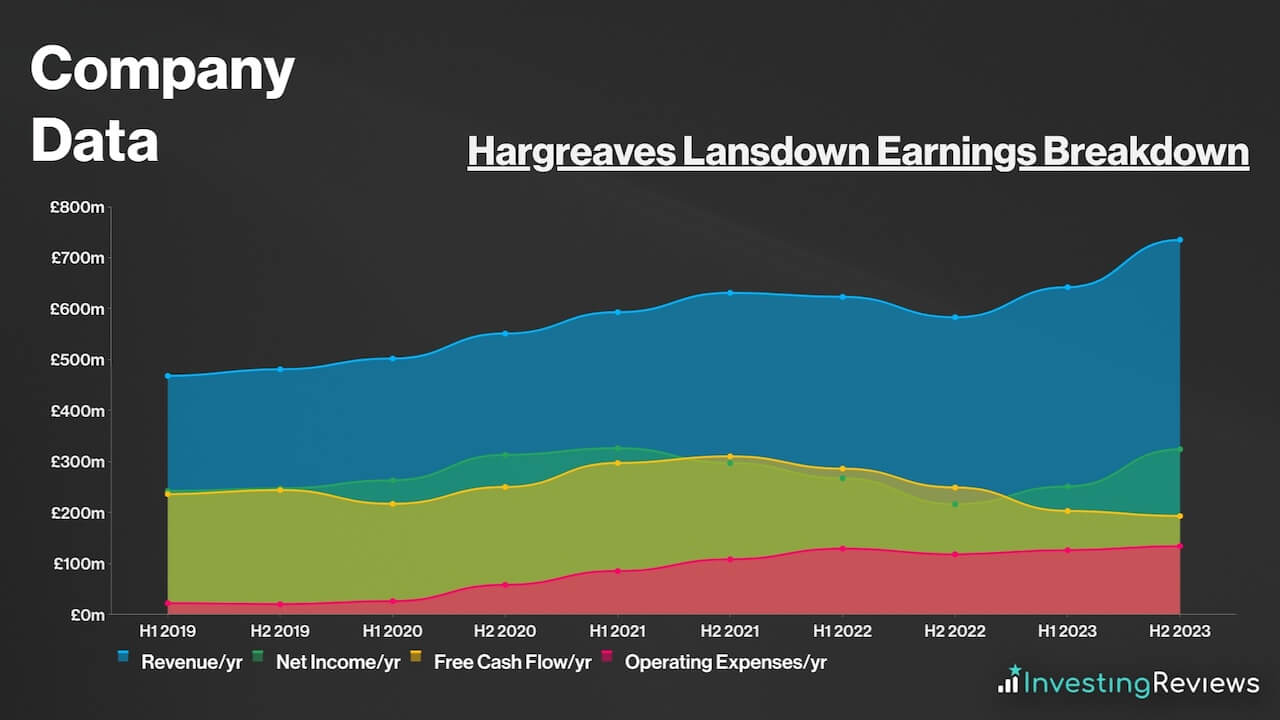
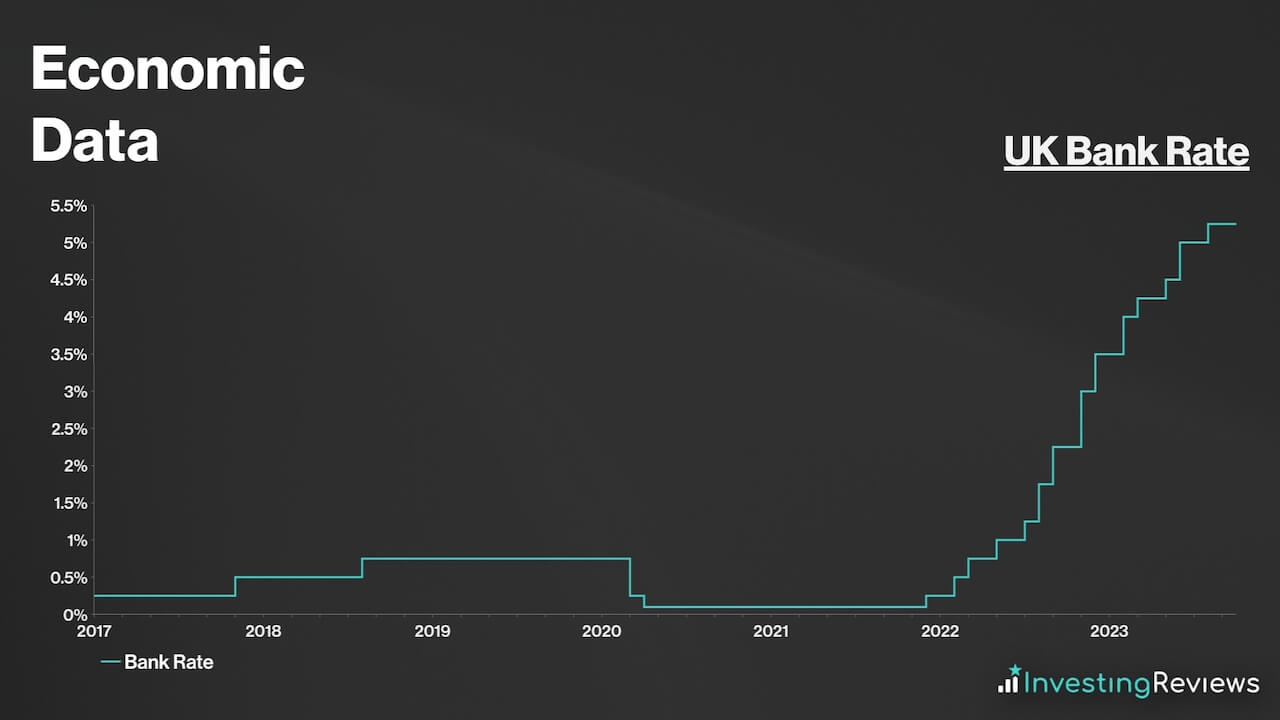
The group’s earnings in FY23 vary greatly from the previous year. The primary reason for this is the evolving interest rate environment. In some respects, investors may see this as a double-edged sword. That’s because higher interest rates tend to divert capital away from equities, thus impacting trading volume, but it also allows Hargreaves Lansdown to earn greater margins on its clients’ cash.
As interest rates have risen, there’s been a fall in trading volume, but a substantial increase in net interest income. As such, Hargreaves Lansdown appears to be a net beneficiary of higher interest rates as net interest income increased five-fold in FY23.
Despite this, Hargreaves Lansdown is more likely to thrive when interest rates are in the ‘Goldilocks Zone’. The business suggests that the growth of net interest margin on cash slows as interest rates hit c.5%. With the Bank of England base rate between 2-3%, the margin on cash is likely to be between 150 and 180 bps. Meanwhile, at 5.25%, the expected margin range is between 180 bps to 200bps.
Hargreaves Lansdown Financials
On the face of it, Hargreaves’ balance sheet is flawless, as its current assets trump its current liabilities by £641m. This is considered to be a norm in the brokerage industry, especially for giant brokers as they require significant cushions to absorb the impact of a potential crash in financial markets.
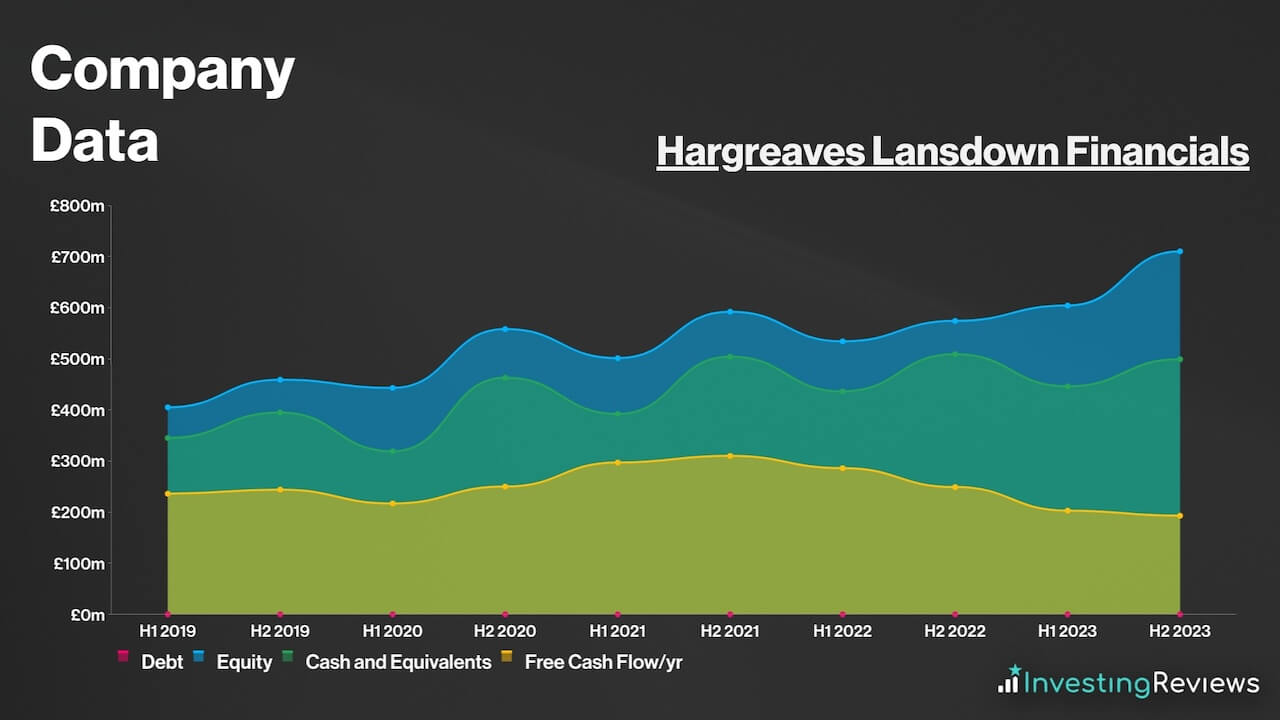
Nevertheless, there are other metrics that might better indicate the conglomerate’s health:
- Operating Margin: Based on operating profit as a percentage of total revenue.
- Debt Coverage: The company’s leverage by examining its debt-to-equity ratio. A high and increasing ratio may indicate financial risk, while a stable or decreasing ratio suggests stability.
- Assets Under Administration/Management (AUA): Total market value of all the financial assets which an individual or financial institution owns.
| Metrics | Hargreaves Lansdown | Industry Average |
|---|---|---|
| Operating Margin | 52.3% | 37.8% |
| Debt-to-Equity Ratio | 0% | 12.6% |
| AUA | £134bn | £61.3bn (ex. Charles Schwab) |
Data source: Hargreaves Lansdown, AJ Bell, CMC Markets, IG, Charles Schwab
With virtually no debt, the FTSE 100 stalwart should have sufficient liquidity to continue operating in the coming years, as long as it continues to generate cash at these levels. It’s also worth noting that Hargreaves has £75m worth of undrawn committed facilities. This means that it has the option to inject more liquidity into the business if it needs to.
Hargreaves Lansdown Competitive Advantage
Having an economic moat (competitive advantage) over competitors is crucial in competitive industries such as brokerage services, where profit margins can quickly fall off, depending on the interest rate environment.
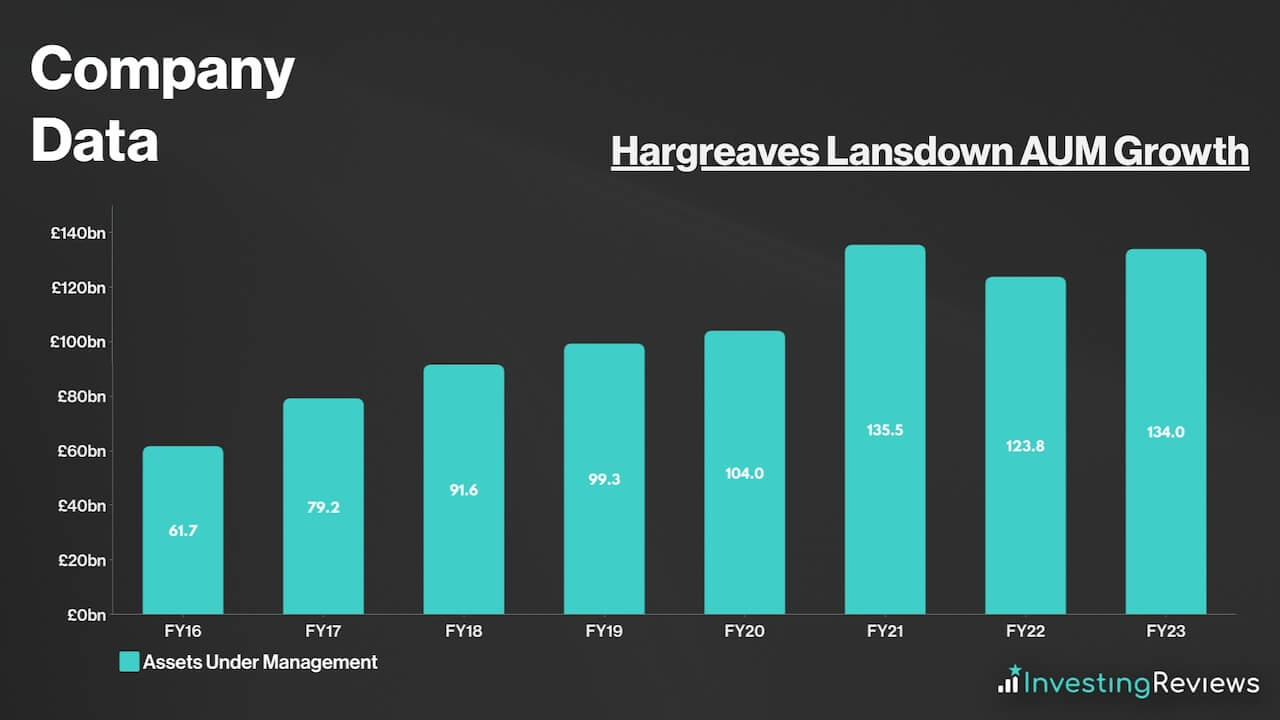
As such, Hargreaves’ main competitive advantage would be its size. As the UK’s largest brokerage, it holds the largest market share amongst retail investors for assets under management, and is renowned as a mainstay of the brokerage industry. Its sizeable £134bn of AUA also means it’s able to leverage off this and generate more net interest income than its peers while arguably keeping fees stable to grow its market share.
To date, however, Hargreaves’ commanding market position is closely linked to the success of its highly intuitive and user-friendly online investment platform with plenty of education resources and an array of investment products. For this reason, the platform is designed to cater to both novice and experienced investors. Its user-centred approach has attracted a diverse client base and enhanced customer retention.
All of these features have enhanced Hargreaves Lansdown’s reputation with investors. The brokerage has cultivated a reputation for reliability, trustworthiness, and excellent customer service. Likewise, its commitment to regulatory compliance provides a sense of security to clients, as they know their investments are held to high standards of governance and protection.
Most importantly, Hargreaves employs a transparent and competitive fee structure. Clients appreciate the clarity in pricing, which includes a fee schedule based on assets under management and trading activity. This transparency builds trust and makes it easier for clients to calculate their costs, where other brokerages have fallen short.
Hargreaves Lansdown Shortcomings
Despite being such a giant in the brokerage space, Hargreaves also has its fair share of weaknesses. This could put investors off when buying Hargreaves Lansdown shares.
For one, Hargreaves’ main weakness would be its relatively higher cost structure compared to some of its competitors. Other brokerages offer lower fees and commissions for trading and managing investments. This cost differential has led some analysts to question whether the premium they pay for Hargreaves Lansdown’s services is justified.
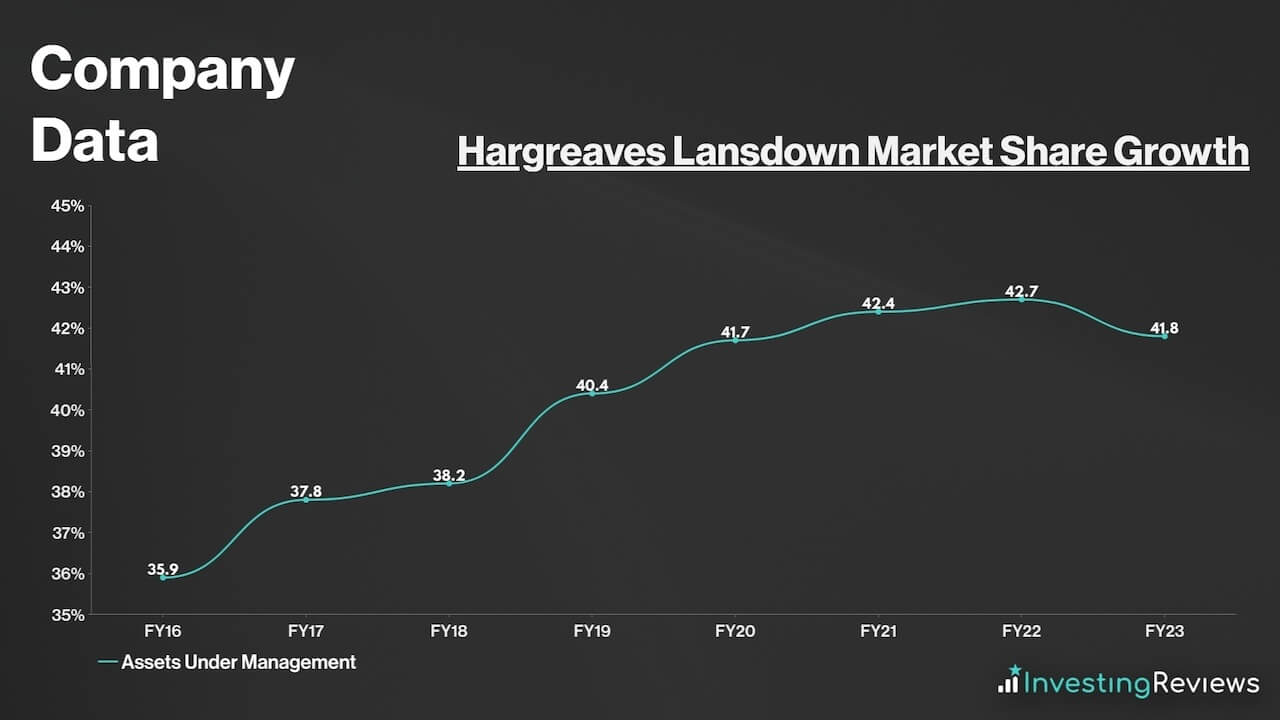
Despite growing its market share over the long term, it’s worth noting that the corporation’s commanding market share has faced some erosion challenges over the past year or so. The investment platform had reached its peak market share of 42.7% in 2021, 90bps above the current position.
Moreover, Hargreaves’ client base is heavily concentrated within the UK. This leaves it vulnerable to fluctuations in the UK economy, regulatory changes, and market conditions specific to the region. A significant economic downturn or regulatory shift could potentially have a more pronounced impact on the FTSE 100 constituent compared to financial institutions with a more diversified international presence.
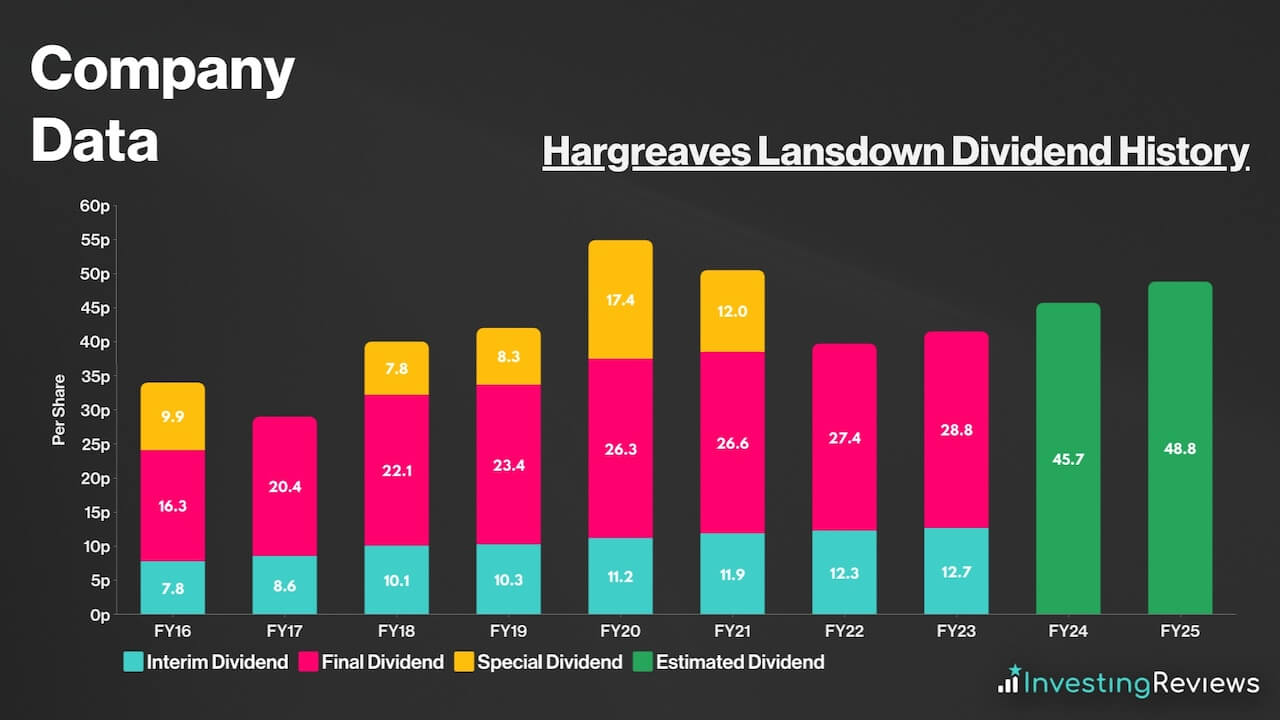
Hargreaves Lansdown pays a dividend and has been paying dividends as far back as 2008; even through the great financial crisis. This makes Hargreaves a dividend aristocrat given its impressive track record of shareholder payments.
For that reason, Hargreaves Lansdown shares are known for their ‘safety’, and are a favourite among dividend investors seeking passive income. The stock is even more popular amongst investors over the past few years due to its growing yields since 2018. In addition to that, its dividends are well covered at 1.6x.
Hargreaves is expecting to continue paying a dividend for the foreseeable future. Currently, analysts are forecasting dividends to rise over the next two years.
Hargreaves Lansdown shares are currently trading at fair value when compared to their industry competitors. Their adjusted P/E ratio is very much in line with the index average too. What’s more, their forward P/E ratio sits comfortably below the FTSE 100, which could indicate growth potential from its earnings.
Among the 16 qualified analysts covering Hargreaves Lansdown shares, the consensus is for Hargreaves to grow its top line over the next two years, with a return to trading volumes being the main catalyst for this. Having said that, analysts see quite a contraction when it comes to its bottom line over the next couple of years as the net interest income tailwinds from cash fades.
| Metrics | FY23 (Reported) | FY24 | FY25 |
|---|---|---|---|
| Revenue | £735.1m | £736.9m | £766.0m |
| Underlying Diluted EPS | 74.3p | 64.67p | 64.25p |
Data source: Hargreaves Lansdown, Financial Times
Hargreaves Lansdown shares currently have an average Buy rating from several brokers. But with an average price target of 985p, brokers seem to agree that there’s upside potential for Hargreaves Lansdown shares in the next 12 months.
| Date | Brokerage | Rating | Price Target |
|---|---|---|---|
| 11/10/2023 | Barclays | Buy | 1250p |
| 25/9/2023 | Jefferies | Buy | 1050p |
| 22/9/2023 | RBC | Hold | 900p |
| 20/9/2023 | JPMorgan | Sell | 711p |
| 24/7/2023 | Deutsche | Sell | 790p |
| 4/5/2023 | Shore Capital | Buy | N/A |
| 6/3/2023 | Berenberg | Hold | 960p |
| 27/2/2023 | Citi | Sell | 730p |
| 15/2/2023 | Numis | Buy | 1679p |
| 15/2/2023 | Peel Hunt | Buy | 1220p |
| 6/2/2023 | Credit Suisse | Sell | 800p |
Data source: Market Screener
My price target for Hargreaves Lansdown shares was last updated on 9th October 2023.
| Metrics | Adjusted FY24 (Projected) | Comments | |
|---|---|---|---|
| Ongoing Revenue | £587m | c.5% decline — moderating interest rates over next 12 months. | |
| Transactional Revenue | £140m | c.20% growth — normalising of share dealing from mutli-year lows as cost-of-living eases and economic conditions normalise. | |
| Revenue | £727m | ||
| Operating Costs | £356m | c.49% of revenue — cost inflation to moderate vs FY22, with cost savings to help. | |
| Operating Profit | £371m | ||
| Finance Income | £20m | Flat interest receivables with moderating interest rates. | |
| Finance Costs | £1m | In line with long-term average. | |
| Profit Before Tax | £390m | ||
| Taxation | £98m | Effective Tax Rate of c.25%, in line with guidance. | |
| Profit for FY24 | £292m | ||
| Shares in Issue | 474.3m | ||
| Underlying Diluted EPS | 61.56p | ||
| Price Target | 985p (BUY) | ||
Looking forward, Hargreaves Lansdown’s own forecasts highlight that moderating interest rates won’t result in a considerable drop off in net interest income. This is important as net interest income has represented a considerable tailwind over the past 12 months. In fact, looking more closely at interest rate forecasts, I’m expecting this tailwind to continue throughout the medium term.
But in the near term, amid an improving or normalising economic environment, Hargreaves Lansdown should expect to see increasing fee income as investors return to equities as cash and debt becomes less attractive. Investor sentiment has been near all-time lows in recent years. As such, I believe this is a very low starting point, hence my price target.
Looking further into the future, as the UK market leader, Hargreaves should be in pole position to dominate. Amid positive long-term trends in self-managed personal investments, the broker should be well-positioned to hover up new clients. It’s also worth highlighting that the firm’s sizeable AUA could also allow it to scrap fees and focus on net interest income.
Dr. James Fox, Equity Research Analyst
Please note: James Fox has positions in Hargreaves Lansdown. These stock analysis reports are not personal recommendations or advice and should never be treated as such.
The value of your investments (and any income from them) can go down as well as up and you may not get back the full amount you invested. Past performance is not a reliable indicator of future performance. Investments should be considered over the longer term and should fit in with your overall attitude to risk and financial circumstances.

