
My BP share price forecast includes a 360-degree examination to determine whether investors should fuel their portfolios with this global oil giant as a long-term investment.
This stock analysis report goes into detail on BP’s financial position, competitive strengths, industry outlook, valuation metrics, and analysts’ predictions to uncover whether BP shares actually present a golden long-term opportunity.
Read On: To find the BP share price forecast and my price target.
BP Background
BP is the UK’s second largest listed hydrocarbons firm, and one of the world’s ‘Big Six’ vertically integrated oil and gas giants. The company specialises in hydrocarbons extraction, production, and distribution. It operates around the world and has joint ventures with dozens of national partners and oil field service providers including Baker Hughes and Schlumberger.
It operates a group of businesses that include Castrol, Amoco, and Wild Bean Cafe. Together with its subsidiaries, BP sells a range of refined crude products and supplementary services at petrol and service stations.
BP shares trade on the London Stock Exchange and are constituents of the FTSE 100.
Find Out: How easy it is to buy BP shares in 6 simple steps.
BP Business Model
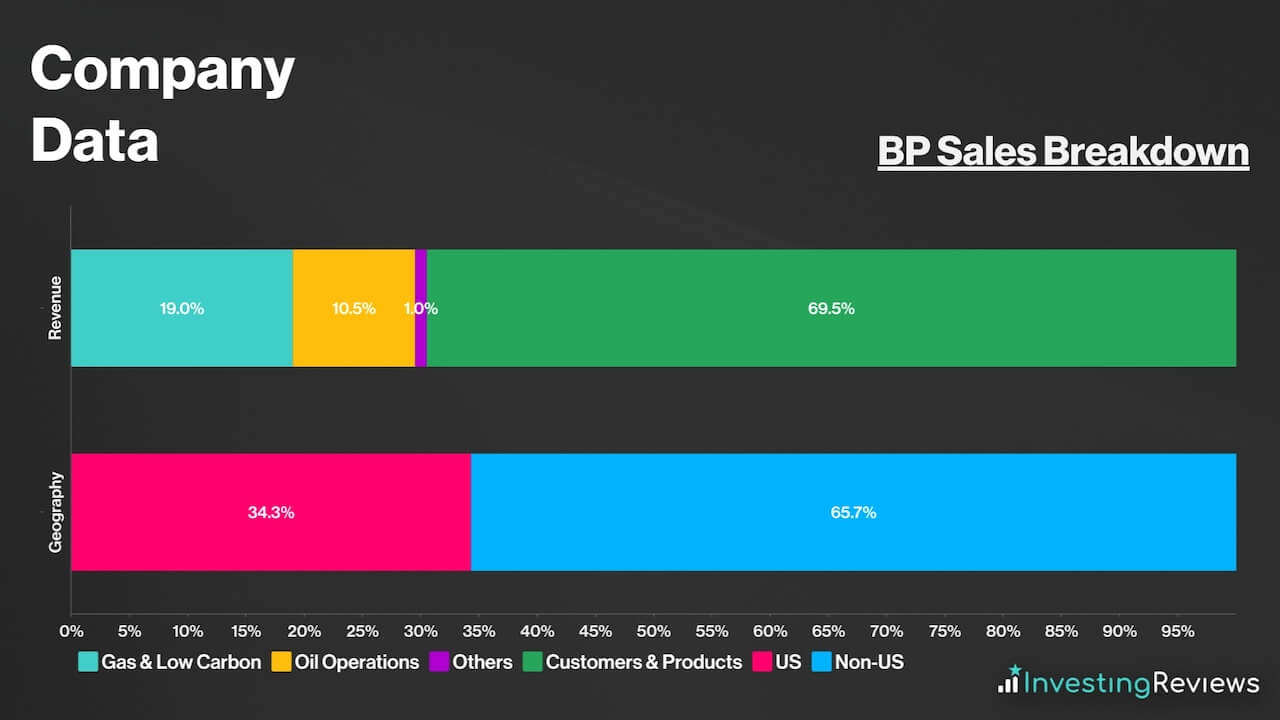
As an oil and gas giant, BP makes its money through a variety of revenue streams. The bulk of its sales usually stems from its upstream operations, where it extracts and produces crude oil, as well as downstream operations, where it refines and distributes petroleum products.
On top of that, BP also generates revenue from its gas and low-carbon energy operations, trading activities, and other ancillary business segments. However, its revenue breakdown is dependent on oil and gas prices, as in 2022 when crude price surged, upstream operations delivered tremendously more replacement cost profit, versus its downstream operations. A similar trend can be observed with gas prices.
On the geographical front, BP is a truly global company with upstream, midstream, and downstream operations around the world, including the US, the UK, Trinidad and Tobago, and Cyprus.
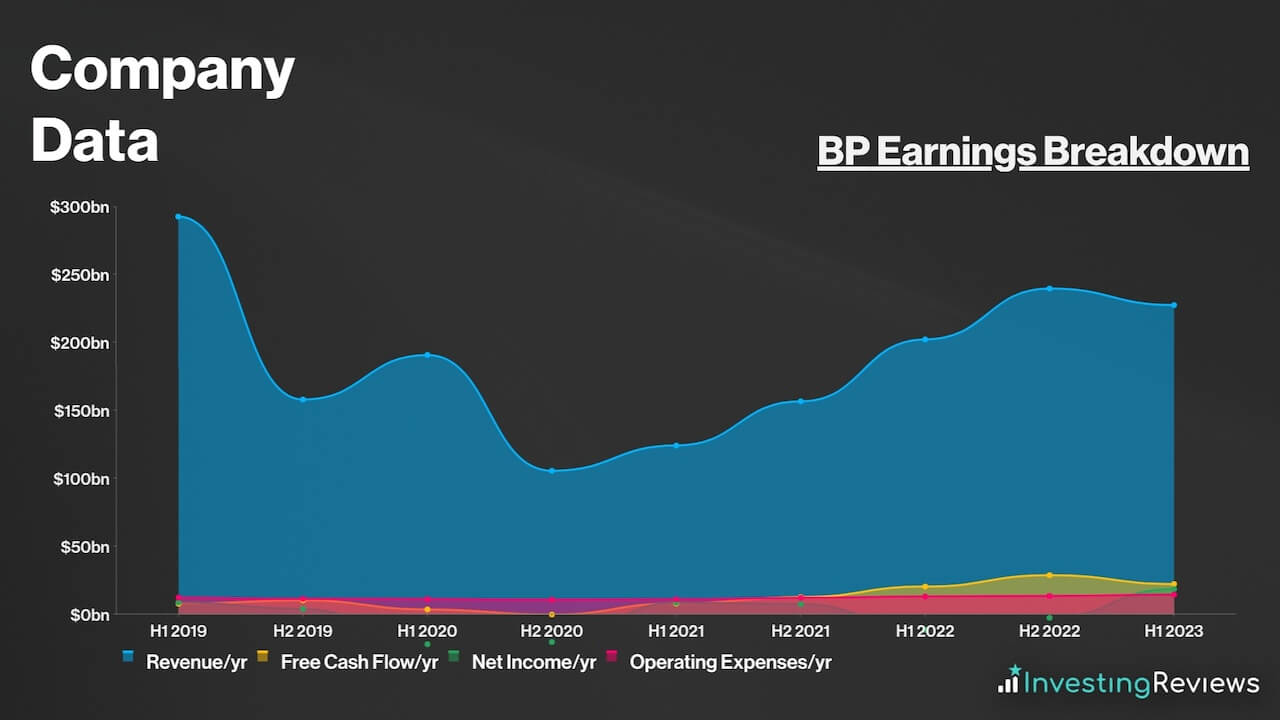
BP Earnings Breakdown
BP operates a vertically integrated business model for the most part, and earns its profits from its oil and gas-focused operations. Because most of its profits stem from its energy business, profit margins are considered to be relatively dependent on energy prices. This is despite operating a diverse business model that includes green energies.
BP Financials
On the face of it, BP’s balance sheet may be off-putting to some as its current liabilities trump its current assets by $13.56bn. Nonetheless, this is considered to be a norm in the hydrocarbons industry, especially for giant oil and gas companies.
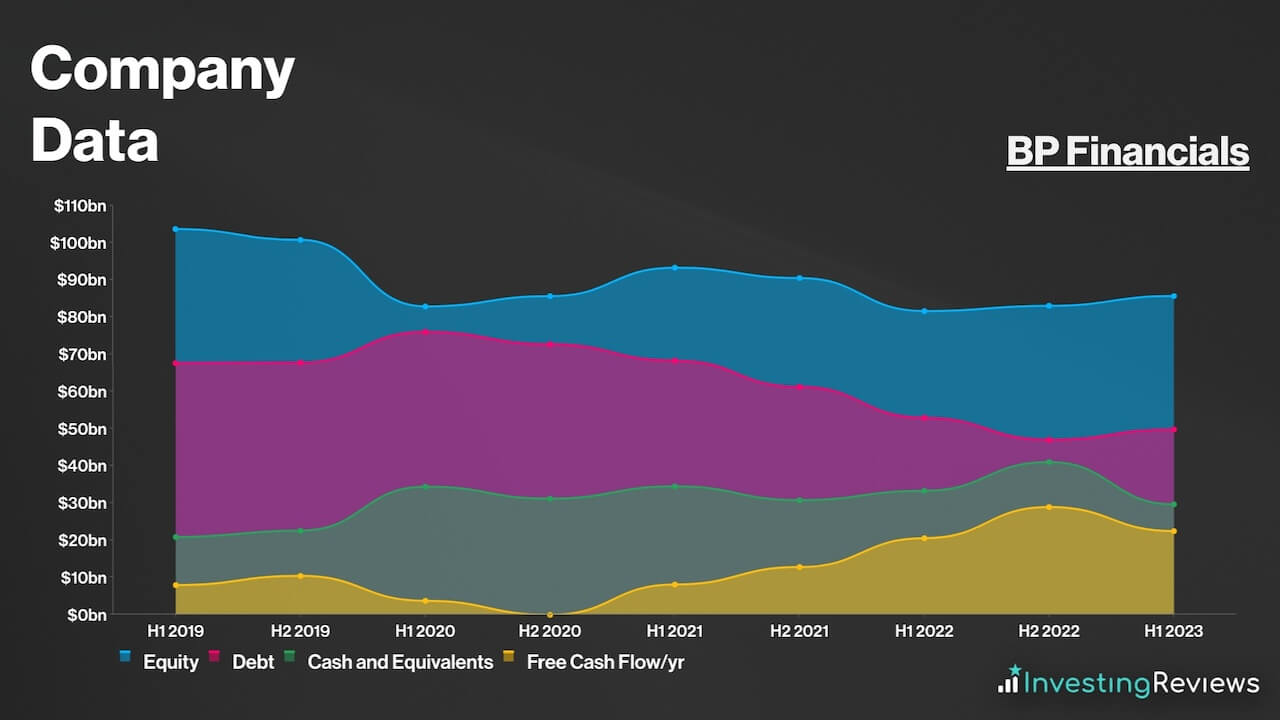
Either way, its debt profile isn’t overly concerning and the firm doesn’t appear to be over leveraged despite having higher debt levels than its peers. Either way, its debt maturity profile isn’t alarming, with repayments spread out rather evenly over the course of the next few decades.
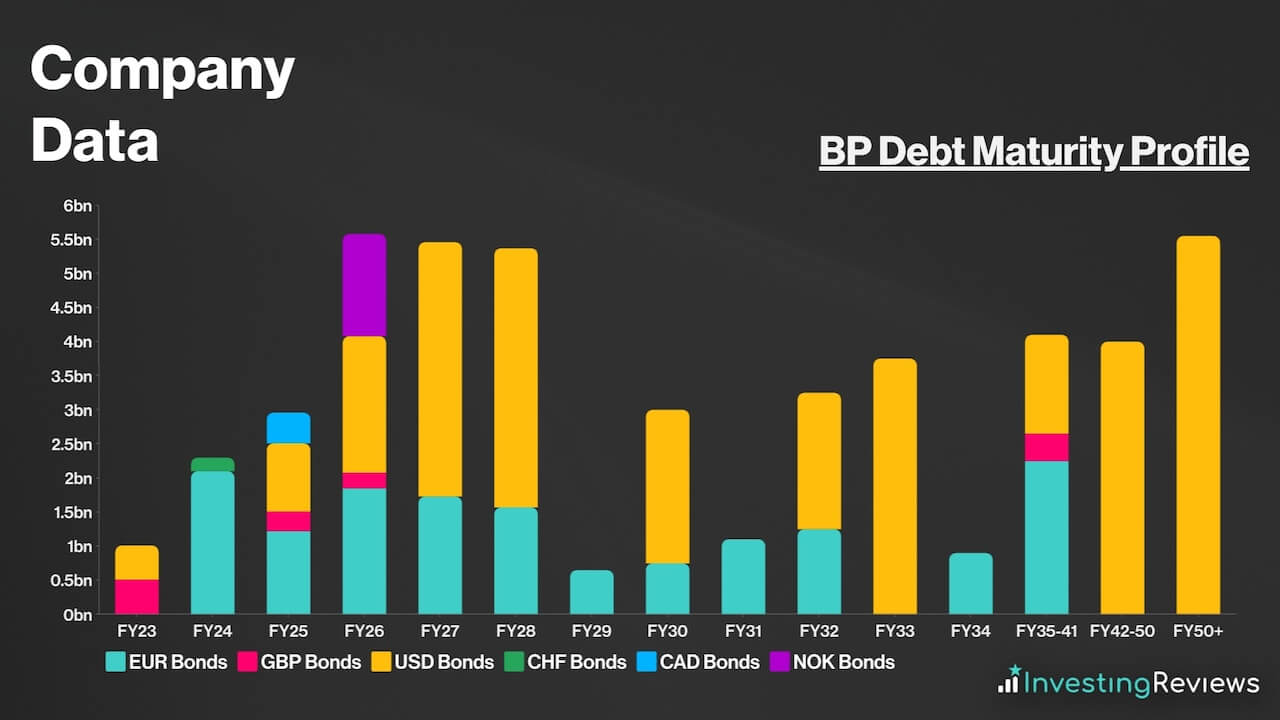
With less than £6bn due per year, over the next decade, BP should have sufficient liquidity to pay off its debt in the coming years, as long as it continues to generate cash at these levels. Moreover, given the current strength of the dollar, its non-USD denominated debt should become cheaper, as all of the group’s debt maturing in the next two years is denominated in non-USD currencies.
Overall, BP currently has a net debt to EBITDA ratio of 1.2x, which is lower than the standard ratio of 3.0x for companies. For those reasons, it’s safe to say that its debt pile is manageable, as the board continues to efficiently utilise capital and generate further value for shareholders.
BP Competitive Advantage
Having an economic moat (competitive advantage) over competitors is crucial in saturated industries such as oil and gas, where profit margins can be volatile, with uncertain market forces dictating the price of commodities.
As such, BP’s main competitive advantage is its low unit production cost. Over the last decade, the consortium has had more cost-efficient upstream operations than many of its peers, including Shell. BP’s relative advantage here reportedly reflects its technological advancements, leaner business model, and the nature of its operational sites.
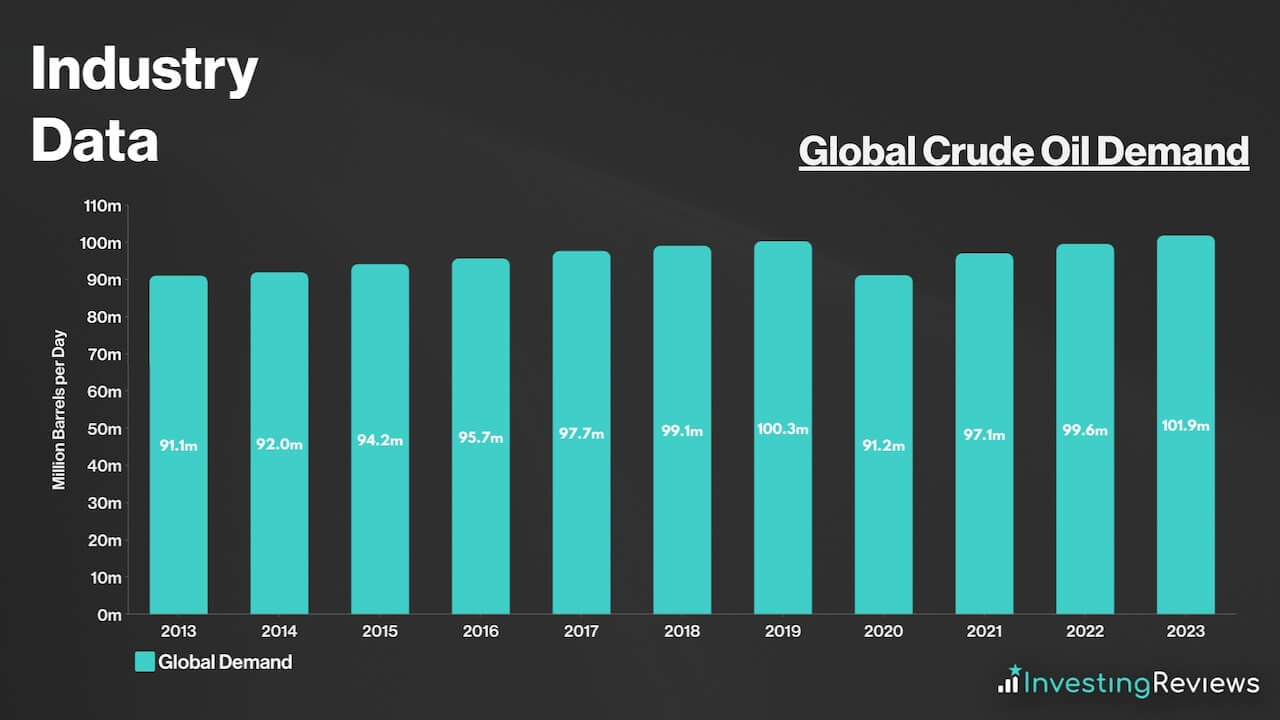
Apart from that, global demand for crude oil doesn’t seem to be slowing either. While alternatives such as green energy have been growing en masse, developing and emerging markets are still and will be heavily reliant on oil to grow their economies. Consequently, this puts BP in a prime position to take advantage of this unprecedented demand.
BP Shortcomings
Despite being such a giant in the oil and gas space, BP also has its fair share of weaknesses. This could put investors off when buying BP shares.
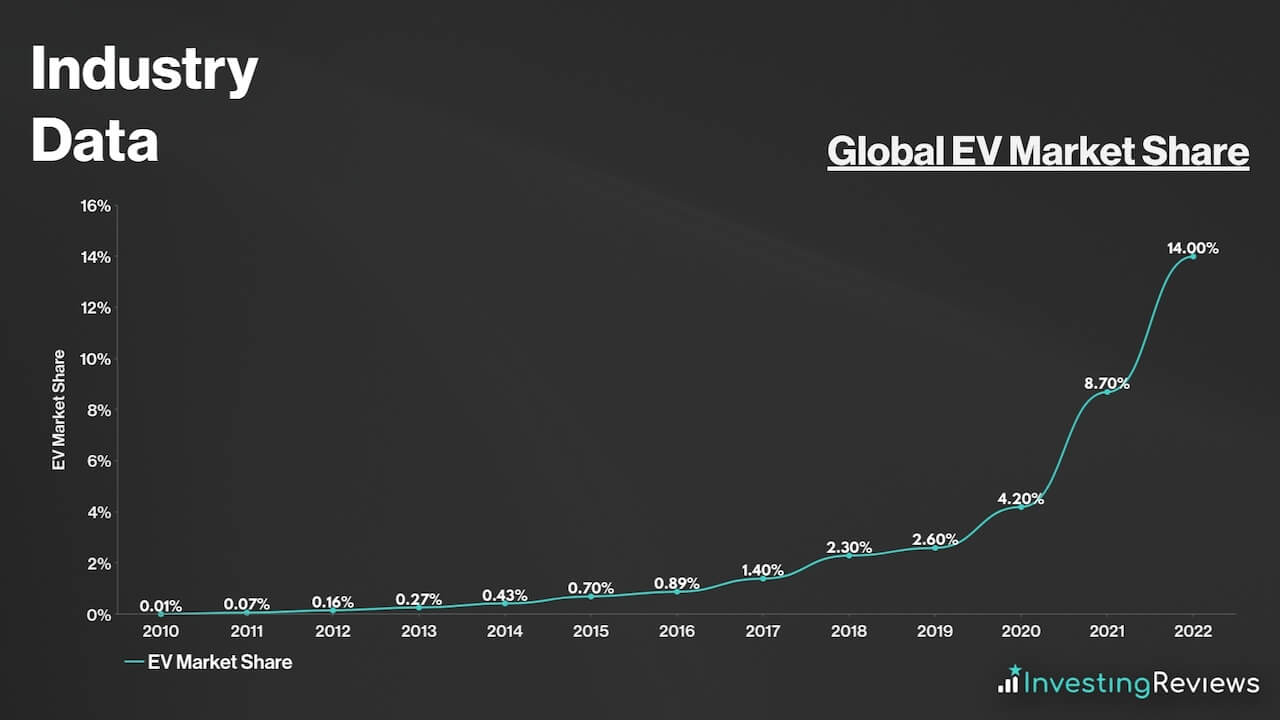
For one, the returns on investments in renewables continue to be quite modest. While electric vehicle (EV) charging is expected to be highly profitable, BP faces stiffer competition in this sector compared to its well-established legacy operations. In fact, the British oil and gas giant finds itself in a challenging position, and could remain among the under performers among its peers.
Therefore, its relatively high return on capital is dependent on one crucial aspect — leverage. The FTSE 100 stalwart remains one of the most highly leveraged companies among its peer group, with a significant difference from the peer average. Part of its debt position relates to fines and the clean up of the Deep Water Horizon disaster of 2010.
Upon closer examination of the producer’s high return on capital, it becomes evident why BP shares are priced at such a significant discount. Two crucial factors driving return on capital are profit margins and asset turnover, and when measuring these variables against its peers, it consistently ranks close to the bottom.
Additionally, in some respects the FTSE 100 mainstay has split priorities – as do several of its peers. On the one hand, the current surge in oil and gas prices is once again incentivising increased reinvestments in the sector. On the other hand, the growing demand for alternatives to oil and gas, such as biofuels, hydrogen, and renewables, calls for more substantial investments in carbon capture and storage.
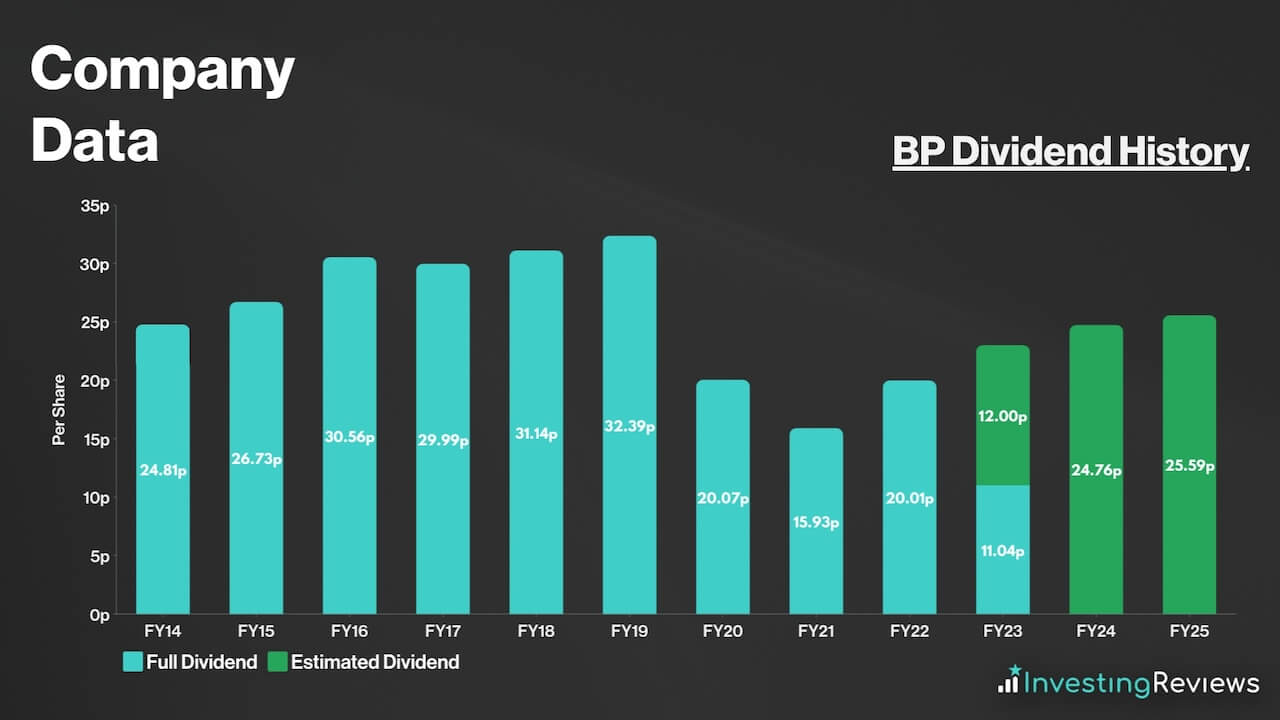
BP pays a dividend and has been paying dividends over the last 30 years and longer. This would make it a dividend aristocrat had it not been for the exceptions of 2010, when it halted payouts. The refiner reported massive cash flow issues at that time, which was a result of the Deepwater Horizon disaster.
Otherwise, BP shares have been a favourite among dividend investors seeking passive income. This is due to the stock’s growing payouts over the years along with the organisation’s commitment to having a progressive dividend. In addition to that, its dividends are well covered at 3.3x.
BP is expecting to continue paying a dividend for the foreseeable future. Currently, analysts are forecasting dividends to rise over the next two years.
BP shares are currently trading at a discount when compared to their industry competitors. Their P/E ratio and forward P/E are very much below the FTSE 100‘s average too. What’s more, their P/S and P/B ratios sit around 1, which could indicate tremendous growth potential from its sales.
Among the 23 qualified analysts covering BP shares, the consensus is for BP to see its top line shrink over the next two years. As for its bottom line, analysts expect it to rebound over the next two years, as the impact of windfall taxes subside.
| Metrics | FY22 (Reported) | FY23 | FY24 |
|---|---|---|---|
| Sales and Other Operating Revenues | $241.39bn | $232.94bn | $216.64bn |
| Diluted EPS | -$0.13 | $0.92 | $1.01 |
Data source: BP, Financial Times
BP shares currently have an average Buy rating from several brokers. With an average price target of 599p, analysts seem to agree that there’s upside potential for BP shares over the next 12 months.
| Date | Brokerage | Rating | Price Target |
|---|---|---|---|
| 20/10/2023 | JPMorgan | Hold | 615p |
| 20/10/2023 | Bank of America | Hold | 540p |
| 13/10/2023 | UBS | Buy | 640p |
| 6/10/2023 | Goldman Sachs | Buy | 660p |
| 6/10/2023 | Citi | Buy | 570p |
| 4/10/2023 | Jefferies | Hold | 530p |
| 13/9/2023 | Barclays | Buy | 1000p |
| 13/9/2023 | Berenberg | Buy | 490p |
| 13/9/2023 | RBC | Buy | 550p |
| 24/8/2023 | LBBW | Buy | 520p |
| 9/8/2023 | HSBC | Buy | 555p |
| 4/5/2023 | Credit Suisse | Hold | 610p |
| 3/5/2023 | Deutsche | Buy | 551p |
| 3/5/2023 | DZ Bank | Hold | 550p |
| 28/3/2023 | Oddo BHF | Hold | 540p |
Data source: Market Screener