No matter where you are in your career, it is never too early to start thinking about retirement and the pension options available to you. Being prepared for the future could be the difference between living comfortably after retirement and having to tighten the purse strings when you should be enjoying post-work life.
Being knowledgeable about your pension as well as the UK standard will help you to prepare for your future, ensuring that you know how much you will need to save and what your contributions should look like.
In order to help you to be fully prepared for your retirement, I have put together the British Pension Report, covering everything from the standard pension contributions for Brits in the workplace as well as some of the most common questions asked about pensions.
Get a FREE Pension Review
Get a free no obligation pension review today from a qualified financial adviser.
Our partner Unbiased will connect you with one of over 27,000 FCA-regulated advisers.
The British Pension Report Executive Summary
I discovered that people seem to be most concerned about their pensions around mid-life, with those aged between 30 and 59 most likely to make pension contributions of 7% or over. These age groups also had the highest rate of enrolment in workplace pension schemes, ensuring that they are taking care of their futures.
However, I also discovered that the UK has one of the lowest pension payouts in comparison to pre-retirement earnings, making it even more essential to start planning for retirement as early as possible.
Read on further for more insights into the state of the British Pension and how it effects you as a UK citizen.
The scale of pension enrolments
Currently, if you are aged 22 or over, but under the state pension age, are earning more than £10,000 per year and are working in the UK, your employer must auto-enrol you into their workplace pension. You can, however, opt out, but you will receive no contributions from your own earnings or your employer.
So who are the employees most likely to be enrolled into a workplace pension and where are they based?
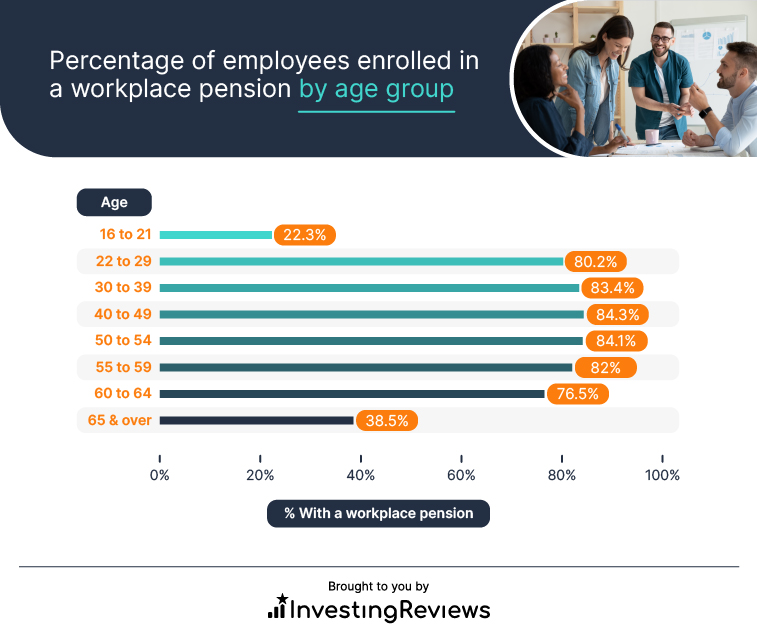
While the 16 to 21 age group has the lowest enrolment rate, this is likely due to the fact that a large number of those in work in this age range will be in part-time employment and low paid work.
The percentage of employees enrolled in workplace pensions seems to peak at the 40 to 49 age group, with it slowly declining as workers get closer to retirement age. Again, this may be partially due to more workers in the older age groups reducing hours or taking on lower-skilled roles, resulting in them no longer being eligible for enrolment in workplace pensions.
Percentage of employees enrolled in a workplace pension by age group
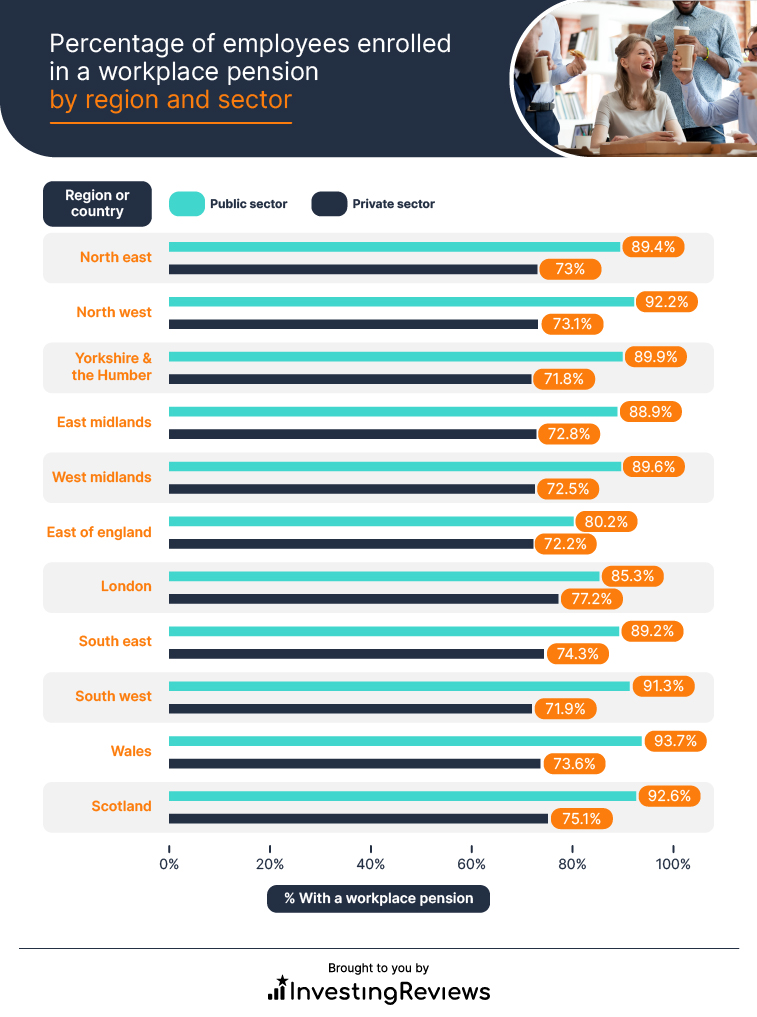
Interestingly, location seems to have an impact on whether employees are enrolled in workplace pensions or not. When we break it down by region, we can see that those living in Wales and working in the public sector are most likely to have a workplace pension, while for those working in the private sector, it is Londoners who are more likely to have a workplace pension.
At the other end of the scale, the public sector workers least likely to be enrolled in a workplace pension live in the East of England, whereas those working in the private sector live in Yorkshire and The Humber.
Percentage of employees enrolled in a workplace pension by region and sector
The employees contributing the most to their pensions
Using government data, I was able to see the types of employees who were contributing the most to their own pension funds based on a number of factors.
Employee contributions by age group
When you look at the employees making the largest contributions to their pensions, I can see that some are willing to set aside 7% or more of their earnings for the future, but which age groups were making these high contributions on the largest scale?
Employees with pension contributions of 7% and over by age group
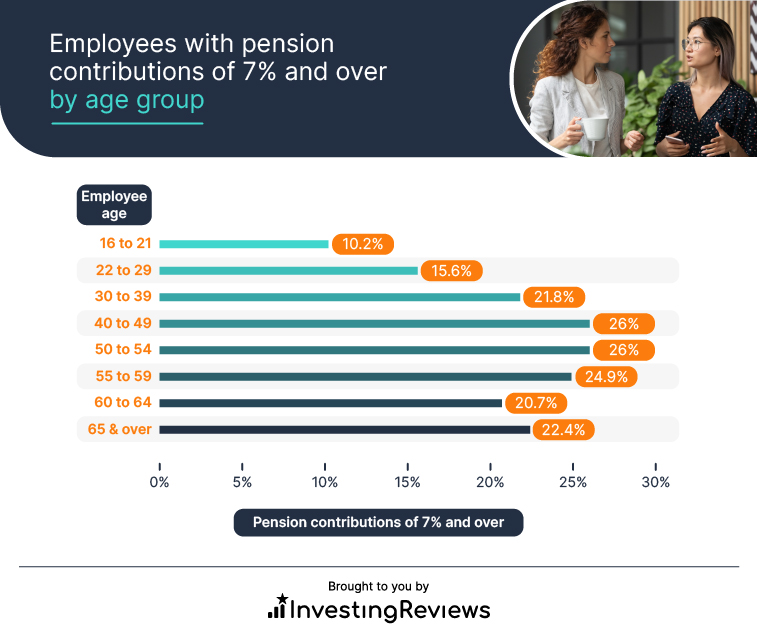
Unsurprisingly, the youngest age group has the lowest likelihood of high pension contributions, with just 10.2% contributing 7% or more. The age groups with the largest percentage of high contributions were 40-49 and 50-54. This is likely due to a greater sense of job security around this age as well as the obvious factor of being closer to retirement age.
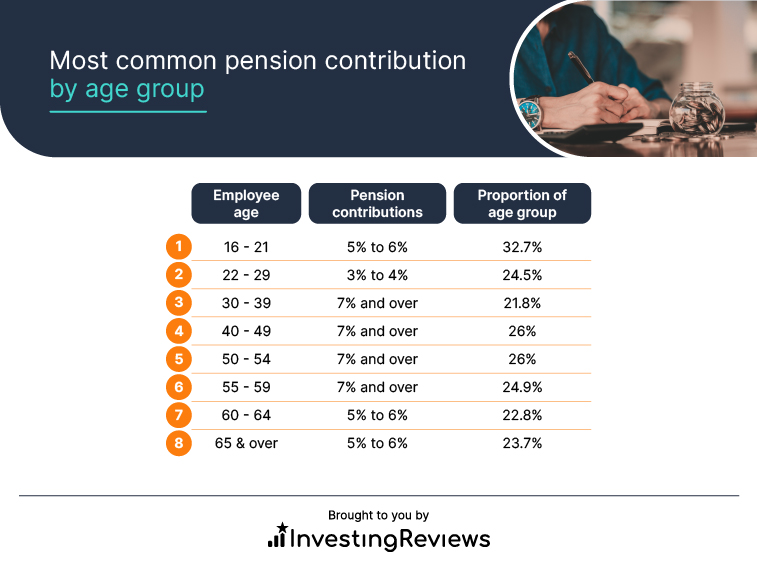
Looking at the most common pension contributions for each age group, we can see the trend in contribution size compared to age group. Between the ages of 30 and 59, employees tend to be making the highest contributions to their pensions, while the majority for all age groups doesn’t drop below 3% contributions, suggesting that UK workers are conscious of their retirement plans.
Most common pension contribution by age group
Employee contributions by occupation
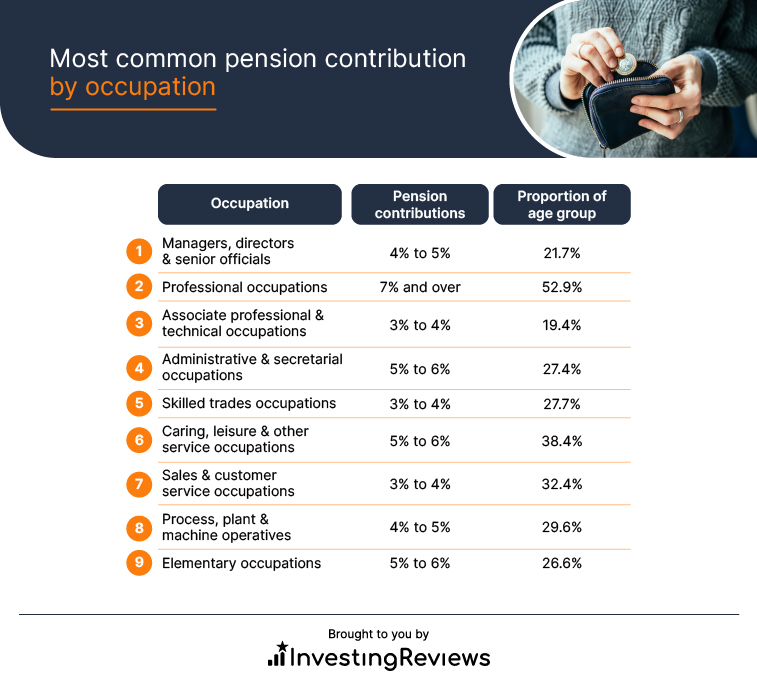
Age is not the only factor in pension contributions, so what about occupation? With each occupation, we can see the impact of salary on pension contributions, though this doesn’t mean that the higher the salary, the higher the contributions. While professional occupations see the highest proportion of workers contributing 7% and over to their pensions, we still see relatively high contributions in lower-paid jobs, such as elementary occupations where contributions of 5% to 6% are most common.
Most common pension contribution by occupation
Methodology:
Data regarding the UK state pension is taken from ONS datasets detailing workplace pensions. This data is from 2020, being the most up-to-date data available.
Google search volumes for pension questions is taken from Google Keyword Planner and looks at annual searches in the UK for each search term.
Global pensions data is taken from OECD’s Net Pension Replacement Rates dataset and takes an average of both men and women’s earnings percentages.
